

Answered step by step
Verified Expert Solution
Question
1 Approved Answer
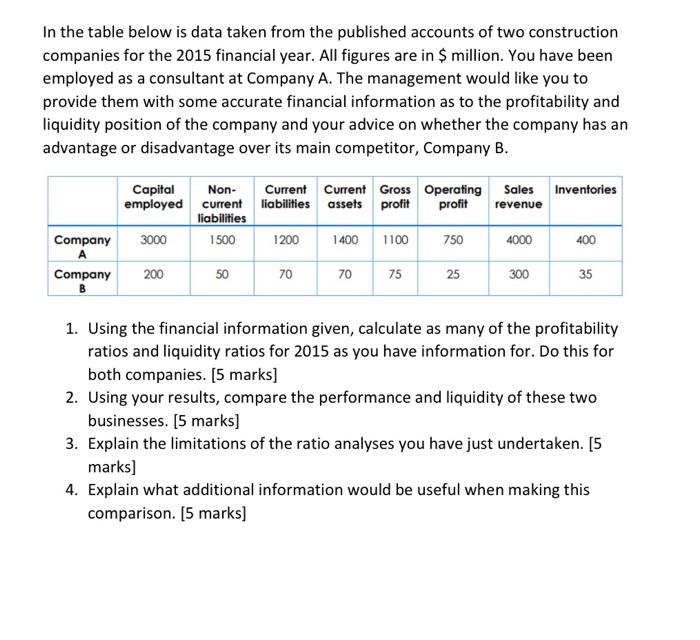
In the table below is data taken from the published accounts of two construction companies for the 2015 financial year. All figures are in $
Step by Step Solution
There are 3 Steps involved in it
Step: 1

Get Instant Access to Expert-Tailored Solutions
See step-by-step solutions with expert insights and AI powered tools for academic success
Step: 2

Step: 3
Ace Your Homework with AI
Get the answers you need in no time with our AI-driven, step-by-step assistance
Get Started
Standards And Audits For Ethics Management Systems The European Perspective
Authors: Josef Wieland
1st Edition
3642072925, 978-3642072925