Answered step by step
Verified Expert Solution
Link Copied!

Question

1 Approved Answer

In this assignment, it is required to calculate descriptive statistics for each numeric variable in the Heart Rate Dataset Steps Open the Heart Rate Excel

In this assignment, it is required to calculate descriptive statistics for each numeric variable in the Heart Rate Dataset

Steps

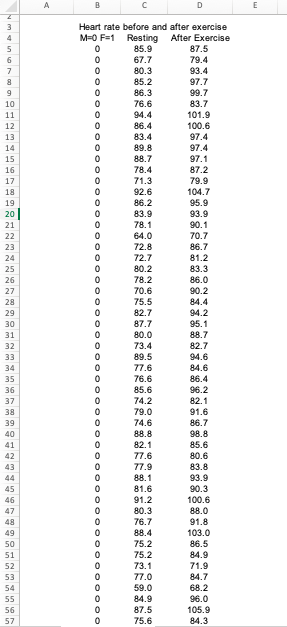
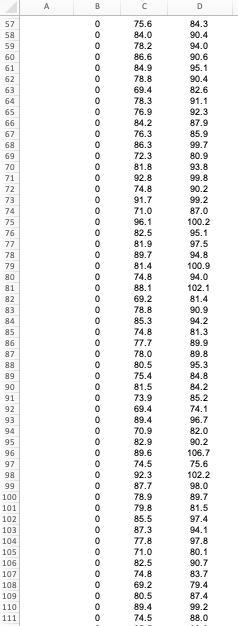
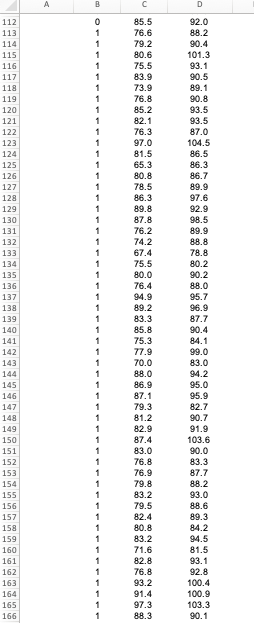
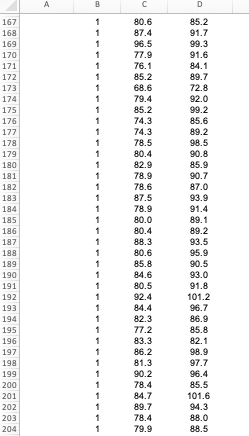
  1. Open the Heart Rate Excel Dataset In Read Me First
  2. Sort the quantitativevariables by class(e.g., Male at-rest heart rate and Female at-rest heart rate)
  3. Use the Excel Data Analysis ToolPak* tools to calculate each of the following statistics:
    1. Mean of each quantitative variable
    2. Sample variance of each quantitative variable
    3. Sample standard deviation of each quantitative variable
  4. Make a table in Excel that summarizes the statistics for each variable.
  5. Transfer your summary results to Word.

Interpret what the mean and standard deviation specifically tell you about the heart rates of males and females in the sample. Are the heart rates for males or females higher? Which data is more spread out and which is closest to the overall mean rate? Explain your responses.

image text in transcribedimage text in transcribedimage text in transcribedimage text in transcribed
\f\fA C D 112 85.5 92.0 113 76.6 88.2 114 79.2 90.4 115 80.6 101.3 116 75.5 93.1 117 83.9 90.5 118 73.9 89. 1 119 76.8 90.8 120 85.2 93.5 121 82.1 93.5 122 76.3 87.0 123 97.0 104.5 124 81.5 86.5 125 65.3 86.3 126 80.8 86.7 127 78.5 89.9 128 86.3 97.6 129 89.8 92.9 130 87.8 98.5 131 76.2 89.9 132 74.2 88.8 133 67.4 78.8 134 75.5 80.2 135 80.0 90.2 136 76.4 88.0 137 94.9 95.7 138 89.2 96.9 139 83.3 87.7 140 85.8 90.4 141 75.3 84.1 142 77.9 99.0 143 70.0 83.0 144 88.0 94.2 145 86.9 95.0 146 87.1 95.9 147 79.3 82.7 148 81.2 90.7 149 82.9 91.9 150 87.4 103.6 151 83.0 90.0 152 76.8 83.3 153 76.9 87.7 154 79.8 88.2 155 83.2 93.0 156 79.5 88.6 157 82.4 89.3 158 80.8 84.2 159 83.2 94.5 160 71.6 81.5 161 82.8 93. 1 162 76.8 92.8 163 93.2 100.4 164 91.4 100.9 165 97.3 103.3 166 88.3 90.1C D 167 80.6 85.2 168 87.4 91.7 169 96.5 99.3 170 77.9 91.6 171 76.1 84.1 172 85.2 89.7 173 68.6 72.8 174 79.4 92.0 175 85.2 99.2 176 74.3 85.6 177 74.3 89.2 178 78.5 98.5 179 80.4 90.8 180 82.9 85.9 181 78.9 90.7 182 78.6 87.0 183 87.5 93.9 184 78.9 91.4 185 80.0 89.1 186 80.4 89.2 187 88.3 93.5 188 80.6 95.9 189 85.8 90.5 190 84.6 93.0 191 80.5 91.8 192 92.4 101.2 193 84.4 96.7 194 82.3 86.9 195 77.2 85.8 196 83.3 82.1 197 86.2 98.9 198 81.3 97.7 199 90.2 96.4 200 78.4 85.5 201 84.7 101.6 202 89.7 94.3 203 78.4 88.0 204 79.9 88.5

Step by Step Solution

There are 3 Steps involved in it

Step: 1

blur-text-image

Get Instant Access to Expert-Tailored Solutions

See step-by-step solutions with expert insights and AI powered tools for academic success

Step: 2

blur-text-image

Step: 3

blur-text-image

Ace Your Homework with AI

Get the answers you need in no time with our AI-driven, step-by-step assistance

Get Started

Recommended Textbook for

Quantitative Analysis For Management

Authors: Barry Render, Ralph M. Stair, Michael E. Hanna

11th Edition

9780132997621, 132149117, 132997622, 978-0132149112

Students also viewed these Mathematics questions

Question

6. Fill in all the cells labeled ??? in the following spreadsheet:

Answered: 1 week ago