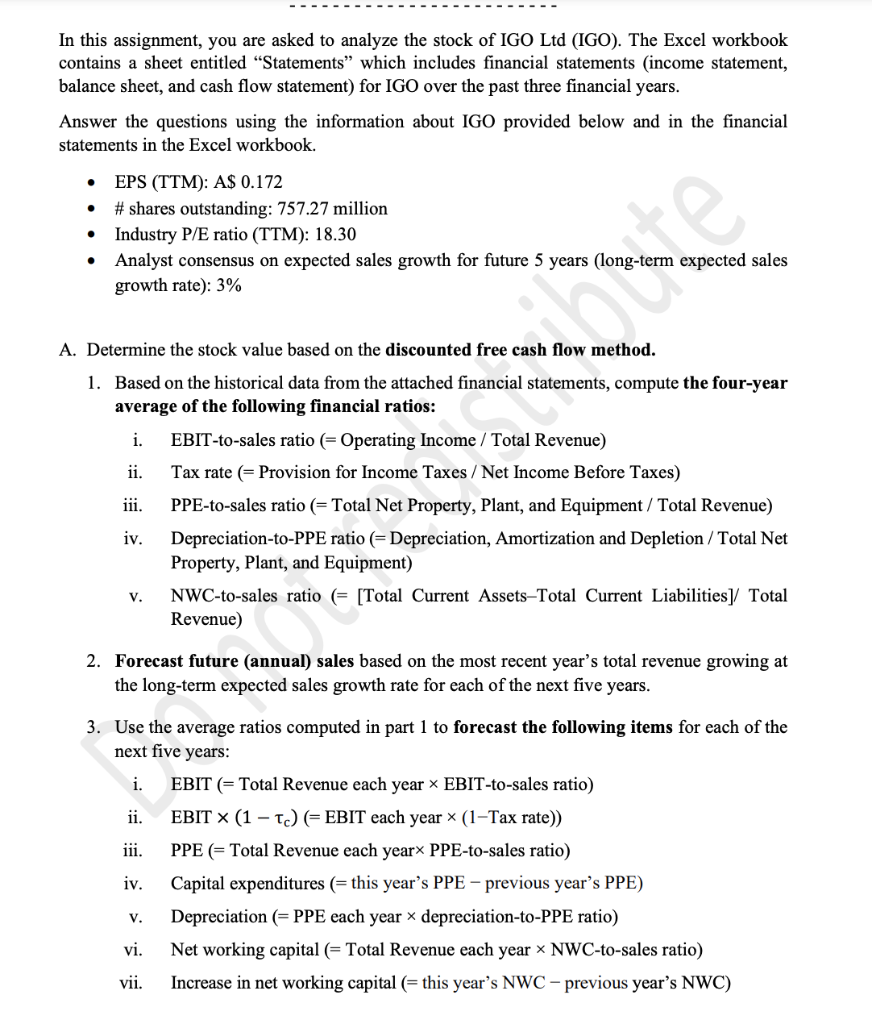
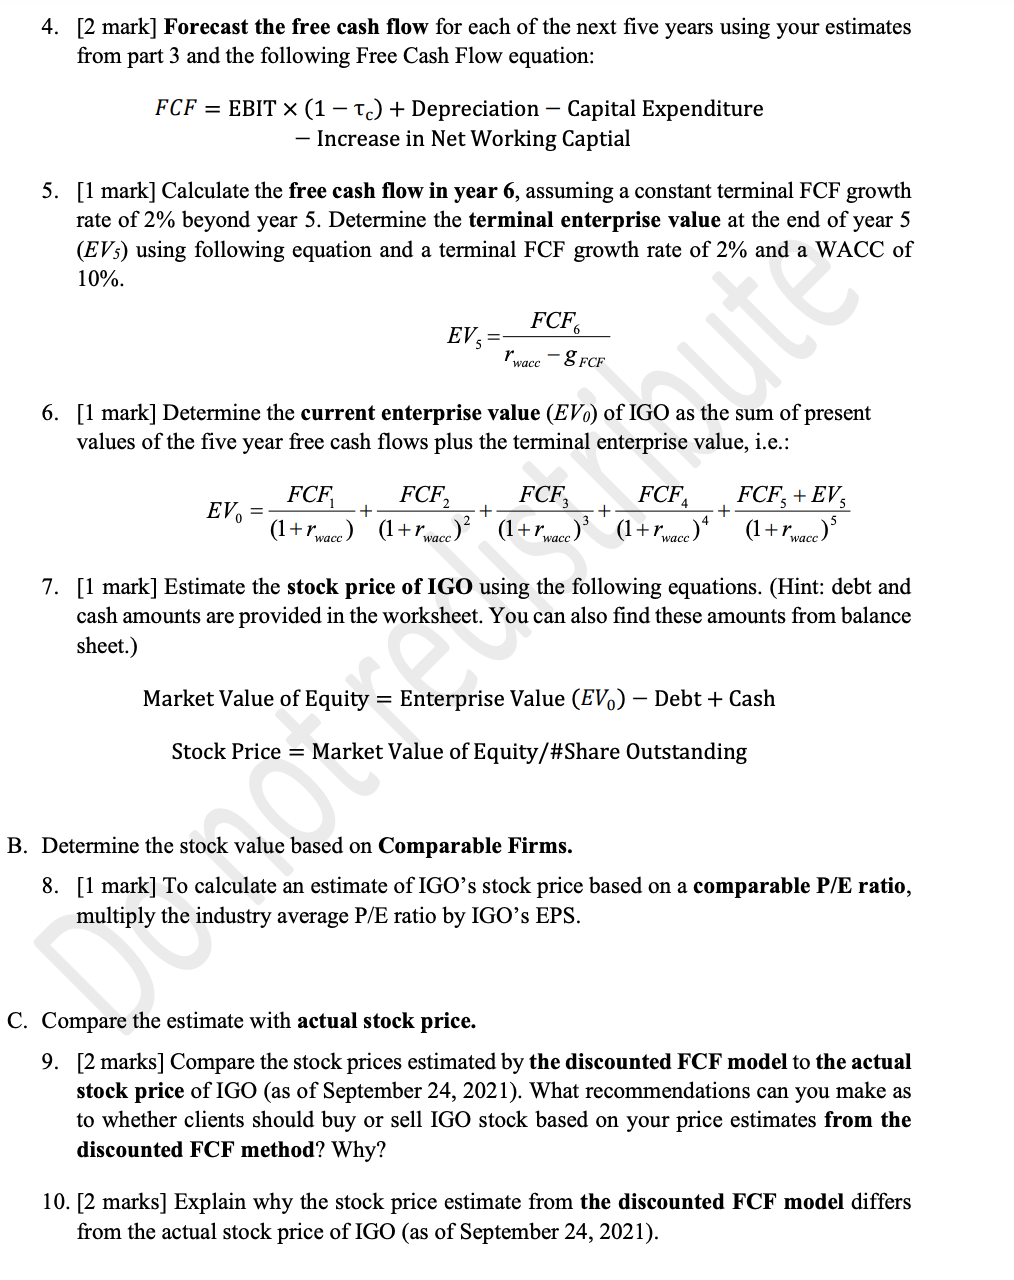
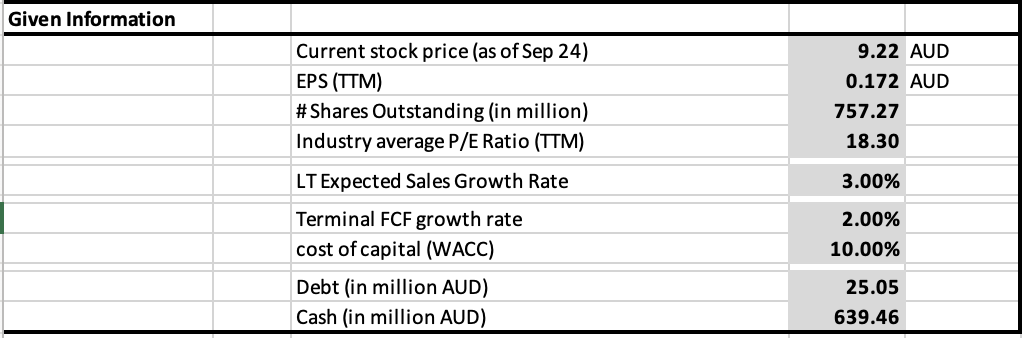
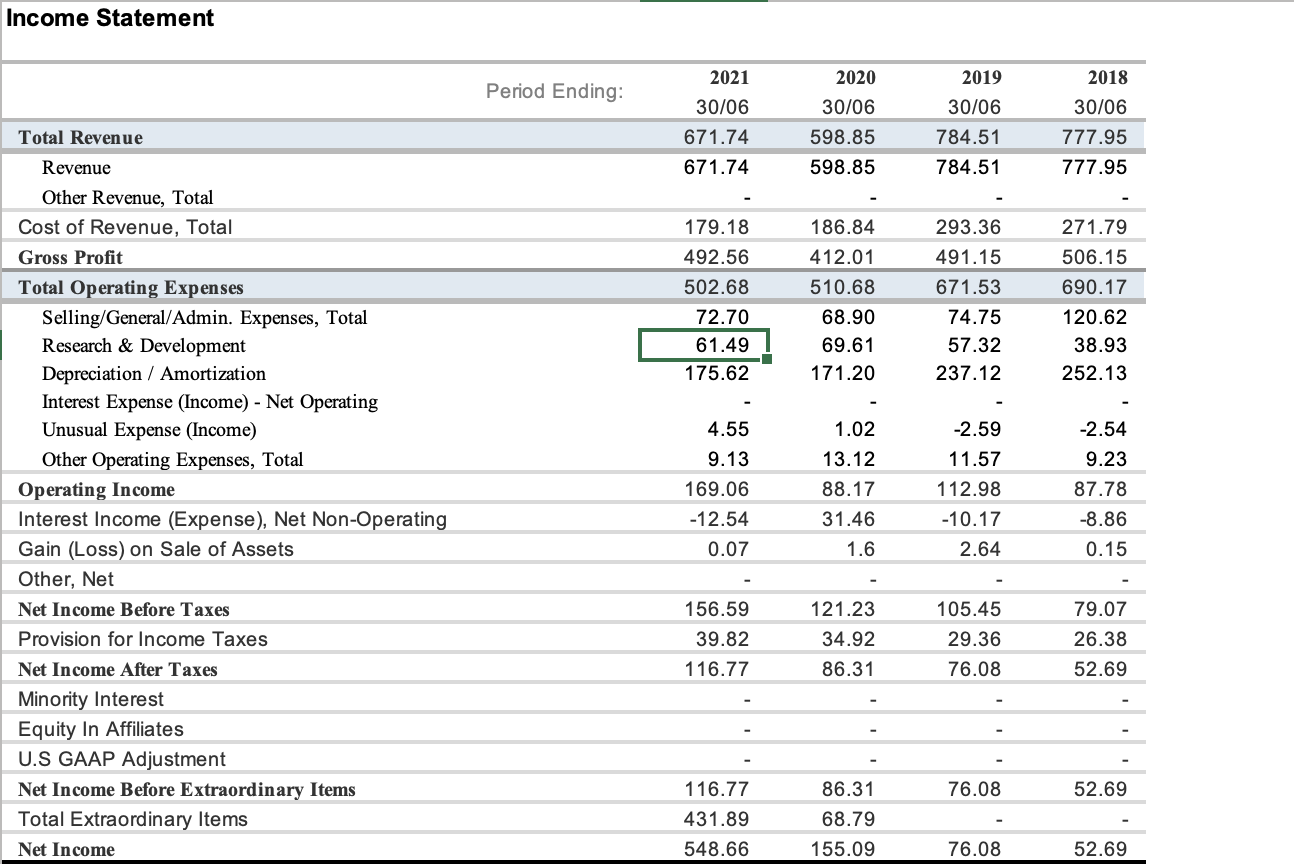
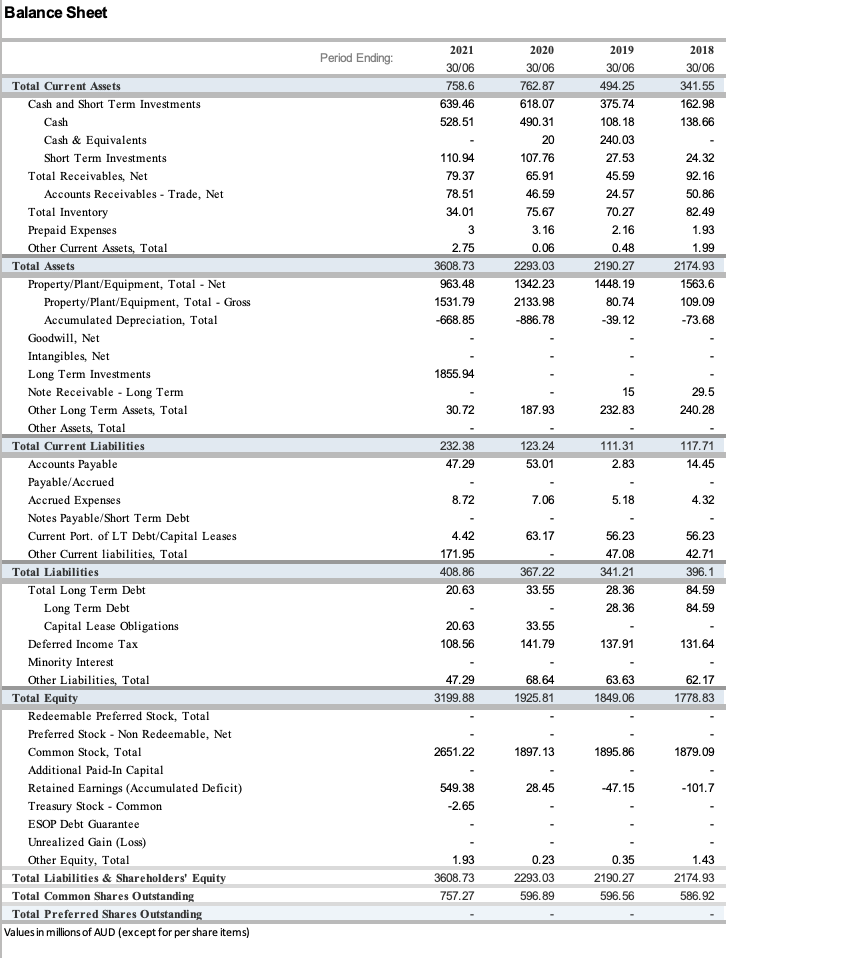
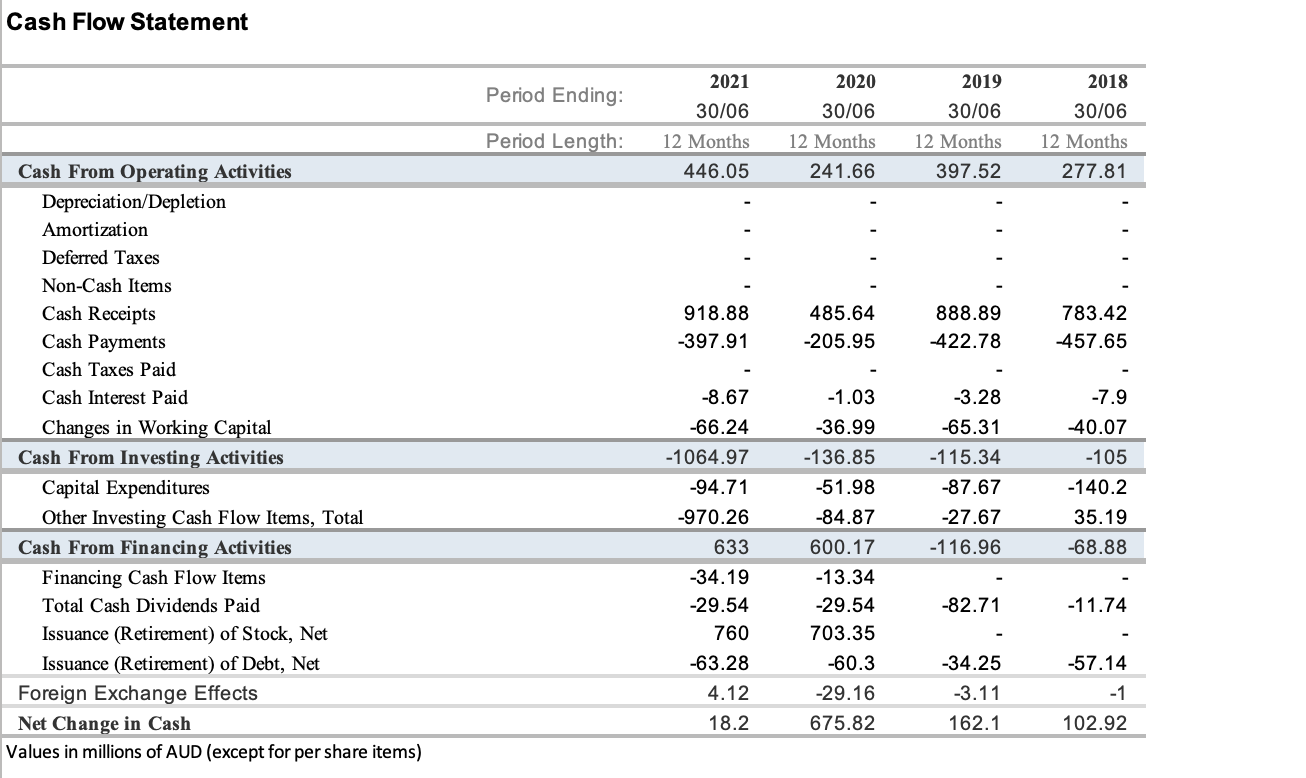
In this assignment, you are asked to analyze the stock of IGO Ltd (IGO). The Excel workbook contains a sheet entitled "Statements which includes financial statements (income statement, balance sheet, and cash flow statement) for IGO over the past three financial years. Answer the questions using the information about IGO provided below and in the financial statements in the Excel workbook. . . EPS (TTM): A$ 0.172 # shares outstanding: 757.27 million Industry P/E ratio (TTM): 18.30 Analyst consensus on expected sales growth for future 5 years (long-term expected sales growth rate): 3% . A. Determine the stock value based on the discounted free cash flow method. 1. Based on the historical data from the attached financial statements, compute the four-year average of the following financial ratios: i. EBIT-to-sales ratio (=Operating Income / Total Revenue) ii. Tax rate (= Provision for Income Taxes / Net Income Before Taxes) iii. PPE-to-sales ratio (= Total Net Property, Plant, and Equipment / Total Revenue) iv. Depreciation-to-PPE ratio (=Depreciation, Amortization and Depletion / Total Net Property, Plant, and Equipment) NWC-to-sales ratio = [Total Current Assets-Total Current Liabilities] Total Revenue) V. watercolor 2. Forecast future (annual) sales based on the most recent year's total revenue growing at the long-term expected sales growth rate for each of the next five years. 3. Use the average ratios computed in part 1 to forecast the following items for each of the next five years: i. EBIT (= Total Revenue each year > EBIT-to-sales ratio) ii. EBIT (1 - 1) =EBIT each year * (1-Tax rate)) iii. PPE = Total Revenue each year PPE-to-sales ratio) iv. Capital expenditures (=this year's PPE - previous year's PPE) V. Depreciation (=PPE each year x depreciation-to-PPE ratio) vi. Net working capital (= Total Revenue each year * NWC-to-sales ratio) vii. Increase in net working capital (=this year's NWC - previous year's NWC) 4. [2 mark] Forecast the free cash flow for each of the next five years using your estimates from part 3 and the following Free Cash Flow equation: FCF = EBIT X(1 - Tc) + Depreciation - Capital Expenditure - Increase in Net Working Captial 5. [1 mark] Calculate the free cash flow in year 6, assuming a constant terminal FCF growth rate of 2% beyond year 5. Determine the terminal enterprise value at the end of year 5 (EV5) using following equation and a terminal FCF growth rate of 2% and a WACC of 10%. FCF EV rwace - S FCF 6. [1 mark] Determine the current enterprise value (EVO) of IGO as the sum of present values of the five year free cash flows plus the terminal enterprise value, i.e.: FCF4 EV. + + FCF FCF FCF, FCF: + EV, (1+rwace) (1+rwace)? ' (1+rwace). (1+rwace). (1+rwace).' 7. [1 mark] Estimate the stock price of IGO using the following equations. (Hint: debt and cash amounts are provided in the worksheet. You can also find these amounts from balance sheet.) Market Value of Equity = Enterprise Value (EV.) Debt + Cash Stock Price = Market Value of Equity/#Share Outstanding B. Determine the stock value based on Comparable Firms. 8. [1 mark] To calculate an estimate of IGO's stock price based on a comparable P/E ratio, multiply the industry average P/E ratio by IGOs EPS. C. Compare the estimate with actual stock price. 9. [2 marks] Compare the stock prices estimated by the discounted FCF model to the actual stock price of IGO (as of September 24, 2021). What recommendations can you make as to whether clients should buy or sell IGO stock based on your price estimates from the discounted FCF method? Why? 10. [2 marks] Explain why the stock price estimate from the discounted FCF model differs from the actual stock price of IGO (as of September 24, 2021). Given Information Current stock price (as of Sep 24) EPS (TTM) #Shares Outstanding (in million) Industry average P/E Ratio (TTM) 9.22 AUD 0.172 AUD 757.27 18.30 LT Expected Sales Growth Rate 3.00% 2.00% 10.00% Terminal FCF growth rate cost of capital (WACC) Debt (in million AUD) Cash (in million AUD) 25.05 639.46 Income Statement 2021 2020 2019 Period Ending: 30/06 671.74 671.74 30/06 598.85 30/06 784.51 784.51 2018 30/06 777.95 777.95 598.85 179.18 492.56 502.68 72.70 61.49 175.62 186.84 412.01 510.68 68.90 69.61 171.20 293.36 491.15 671.53 74.75 57.32 237.12 271.79 506.15 690.17 120.62 38.93 252.13 1.02 Total Revenue Revenue Other Revenue, Total Cost of Revenue, Total Gross Profit Total Operating Expenses Selling/General/Admin. Expenses, Total Research & Development Depreciation / Amortization Interest Expense (Income) - Net Operating Unusual Expense (Income) Other Operating Expenses, Total Operating Income Interest Income (Expense), Net Non-Operating Gain (Loss) on Sale of Assets Other, Net Net Income Before Taxes Provision for Income Taxes Net Income After Taxes Minority Interest Equity In Affiliates U.S GAAP Adjustment Net Income Before Extraordinary Items Total Extraordinary Items Net Income 4.55 9.13 169.06 -12.54 0.07 13.12 88.17 31.46 1.6 -2.59 11.57 112.98 -10.17 2.64 -2.54 9.23 87.78 -8.86 0.15 121.23 156.59 39.82 116.77 34.92 86.31 105.45 29.36 76.08 79.07 26.38 52.69 76.08 52.69 116.77 431.89 548.66 86.31 68.79 155.09 76.08 52.69 Balance Sheet 2018 Period Ending: 2021 30/06 758.6 639.46 528.51 30/06 341.55 162.98 138.66 110.94 79.37 78.51 34.01 3 2020 30/06 762.87 618.07 490.31 20 107.76 65.91 46.59 75.67 3.16 0.06 2293.03 1342.23 2133.98 -886.78 2019 30/06 494.25 375.74 108.18 240.03 27.53 45.59 24.57 70.27 2.16 0.48 2190.27 1448.19 80.74 -39.12 24.32 92.16 50.86 82.49 1.93 1.99 2174.93 2.75 3608.73 963.48 1531.79 1563.6 109.09 -73.68 -668.85 1855.94 15 232.83 29.5 240.28 30.72 187.93 232.38 47.29 123.24 53.01 111.31 2.83 117.71 14.45 8.72 7.06 5.18 4.32 Total Current Assets Cash and Short Term Investments Cash Cash & Equivalents Short Term Investments Total Receivables, Net Accounts Receivables - Trade, Net Total Inventory Prepaid Expenses Other Current Assets, Total Total Assets Property/Plant/Equipment, Total - Net Property/Plant/Equipment, Total - Gross Accumulated Depreciation, Total Goodwill, Net Intangibles, Net Long Term Investments Note Receivable - Long Term Other Long Term Assets, Total Other Assets, Total Total Current Liabilities Accounts Payable Payable/Accrued Accrued Expenses Notes Payable/Short Term Debt Current Port of LT Debt/Capital Leases Other Current liabilities, Total Total Liabilities Total Long Term Debt Long Term Debt Capital Lease Obligations Deferred Income Tax Minority Interest Other Liabilities, Total Total Equity Redeemable Preferred Stock, Total Preferred Stock - Non Redeemable, Net Common Stock, Total Additional Paid-In Capital Retained Earnings (Accumulated Deficit) Treasury Stock - Common ESOP Debt Guarantee Unrealized Gain (Loss) Other Equity, Total Total Liabilities & Shareholders' Equity Total Common Shares Outstanding Total Preferred Shares Outstanding Values in millions of AUD (except for per share items) 63.17 56.23 56.23 4.42 171.95 408.86 20.63 367.22 47.08 341.21 28.36 28.36 42.71 396.1 84.59 84.59 33.55 20.63 108.56 33.55 141.79 137.91 131.64 47.29 3199.88 68.64 1925.81 63.63 1849.06 62.17 1778.83 2651.22 1897.13 1895.86 1879.09 28.45 -47.15 -101.7 549.38 -2.65 1.93 3608.73 0.23 2293.03 596.89 0.35 2190.27 596.56 1.43 2174.93 586.92 757.27 Cash Flow Statement 2021 2019 2018 Period Ending: 30/06 30/06 12 Months 2020 30/06 12 Months 241.66 Period Length: 12 Months 30/06 12 Months 277.81 446.05 397.52 918.88 -397.91 485.64 -205.95 888.89 422.78 783.42 -457.65 Cash From Operating Activities Depreciation/Depletion Amortization Deferred Taxes Non-Cash Items Cash Receipts Cash Payments Cash Taxes Paid Cash Interest Paid Changes in Working Capital Cash From Investing Activities Capital Expenditures Other Investing Cash Flow Items, Total Cash From Financing Activities Financing Cash Flow Items Total Cash Dividends Paid Issuance (Retirement) of Stock, Net Issuance (Retirement) of Debt, Net Foreign Exchange Effects Net Change in Cash Values in millions of AUD (except for per share items) -3.28 -65.31 -115.34 -87.67 -27.67 -116.96 -7.9 -40.07 -105 -140.2 35.19 -68.88 -8.67 -66.24 -1064.97 -94.71 -970.26 633 -34.19 -29.54 760 -63.28 4.12 18.2 -1.03 -36.99 -136.85 -51.98 -84.87 600.17 -13.34 -29.54 703.35 -60.3 -29.16 675.82 -82.71 -11.74 -34.25 -3.11 162.1 -57.14 -1 102.92 In this assignment, you are asked to analyze the stock of IGO Ltd (IGO). The Excel workbook contains a sheet entitled "Statements which includes financial statements (income statement, balance sheet, and cash flow statement) for IGO over the past three financial years. Answer the questions using the information about IGO provided below and in the financial statements in the Excel workbook. . . EPS (TTM): A$ 0.172 # shares outstanding: 757.27 million Industry P/E ratio (TTM): 18.30 Analyst consensus on expected sales growth for future 5 years (long-term expected sales growth rate): 3% . A. Determine the stock value based on the discounted free cash flow method. 1. Based on the historical data from the attached financial statements, compute the four-year average of the following financial ratios: i. EBIT-to-sales ratio (=Operating Income / Total Revenue) ii. Tax rate (= Provision for Income Taxes / Net Income Before Taxes) iii. PPE-to-sales ratio (= Total Net Property, Plant, and Equipment / Total Revenue) iv. Depreciation-to-PPE ratio (=Depreciation, Amortization and Depletion / Total Net Property, Plant, and Equipment) NWC-to-sales ratio = [Total Current Assets-Total Current Liabilities] Total Revenue) V. watercolor 2. Forecast future (annual) sales based on the most recent year's total revenue growing at the long-term expected sales growth rate for each of the next five years. 3. Use the average ratios computed in part 1 to forecast the following items for each of the next five years: i. EBIT (= Total Revenue each year > EBIT-to-sales ratio) ii. EBIT (1 - 1) =EBIT each year * (1-Tax rate)) iii. PPE = Total Revenue each year PPE-to-sales ratio) iv. Capital expenditures (=this year's PPE - previous year's PPE) V. Depreciation (=PPE each year x depreciation-to-PPE ratio) vi. Net working capital (= Total Revenue each year * NWC-to-sales ratio) vii. Increase in net working capital (=this year's NWC - previous year's NWC) 4. [2 mark] Forecast the free cash flow for each of the next five years using your estimates from part 3 and the following Free Cash Flow equation: FCF = EBIT X(1 - Tc) + Depreciation - Capital Expenditure - Increase in Net Working Captial 5. [1 mark] Calculate the free cash flow in year 6, assuming a constant terminal FCF growth rate of 2% beyond year 5. Determine the terminal enterprise value at the end of year 5 (EV5) using following equation and a terminal FCF growth rate of 2% and a WACC of 10%. FCF EV rwace - S FCF 6. [1 mark] Determine the current enterprise value (EVO) of IGO as the sum of present values of the five year free cash flows plus the terminal enterprise value, i.e.: FCF4 EV. + + FCF FCF FCF, FCF: + EV, (1+rwace) (1+rwace)? ' (1+rwace). (1+rwace). (1+rwace).' 7. [1 mark] Estimate the stock price of IGO using the following equations. (Hint: debt and cash amounts are provided in the worksheet. You can also find these amounts from balance sheet.) Market Value of Equity = Enterprise Value (EV.) Debt + Cash Stock Price = Market Value of Equity/#Share Outstanding B. Determine the stock value based on Comparable Firms. 8. [1 mark] To calculate an estimate of IGO's stock price based on a comparable P/E ratio, multiply the industry average P/E ratio by IGOs EPS. C. Compare the estimate with actual stock price. 9. [2 marks] Compare the stock prices estimated by the discounted FCF model to the actual stock price of IGO (as of September 24, 2021). What recommendations can you make as to whether clients should buy or sell IGO stock based on your price estimates from the discounted FCF method? Why? 10. [2 marks] Explain why the stock price estimate from the discounted FCF model differs from the actual stock price of IGO (as of September 24, 2021). Given Information Current stock price (as of Sep 24) EPS (TTM) #Shares Outstanding (in million) Industry average P/E Ratio (TTM) 9.22 AUD 0.172 AUD 757.27 18.30 LT Expected Sales Growth Rate 3.00% 2.00% 10.00% Terminal FCF growth rate cost of capital (WACC) Debt (in million AUD) Cash (in million AUD) 25.05 639.46 Income Statement 2021 2020 2019 Period Ending: 30/06 671.74 671.74 30/06 598.85 30/06 784.51 784.51 2018 30/06 777.95 777.95 598.85 179.18 492.56 502.68 72.70 61.49 175.62 186.84 412.01 510.68 68.90 69.61 171.20 293.36 491.15 671.53 74.75 57.32 237.12 271.79 506.15 690.17 120.62 38.93 252.13 1.02 Total Revenue Revenue Other Revenue, Total Cost of Revenue, Total Gross Profit Total Operating Expenses Selling/General/Admin. Expenses, Total Research & Development Depreciation / Amortization Interest Expense (Income) - Net Operating Unusual Expense (Income) Other Operating Expenses, Total Operating Income Interest Income (Expense), Net Non-Operating Gain (Loss) on Sale of Assets Other, Net Net Income Before Taxes Provision for Income Taxes Net Income After Taxes Minority Interest Equity In Affiliates U.S GAAP Adjustment Net Income Before Extraordinary Items Total Extraordinary Items Net Income 4.55 9.13 169.06 -12.54 0.07 13.12 88.17 31.46 1.6 -2.59 11.57 112.98 -10.17 2.64 -2.54 9.23 87.78 -8.86 0.15 121.23 156.59 39.82 116.77 34.92 86.31 105.45 29.36 76.08 79.07 26.38 52.69 76.08 52.69 116.77 431.89 548.66 86.31 68.79 155.09 76.08 52.69 Balance Sheet 2018 Period Ending: 2021 30/06 758.6 639.46 528.51 30/06 341.55 162.98 138.66 110.94 79.37 78.51 34.01 3 2020 30/06 762.87 618.07 490.31 20 107.76 65.91 46.59 75.67 3.16 0.06 2293.03 1342.23 2133.98 -886.78 2019 30/06 494.25 375.74 108.18 240.03 27.53 45.59 24.57 70.27 2.16 0.48 2190.27 1448.19 80.74 -39.12 24.32 92.16 50.86 82.49 1.93 1.99 2174.93 2.75 3608.73 963.48 1531.79 1563.6 109.09 -73.68 -668.85 1855.94 15 232.83 29.5 240.28 30.72 187.93 232.38 47.29 123.24 53.01 111.31 2.83 117.71 14.45 8.72 7.06 5.18 4.32 Total Current Assets Cash and Short Term Investments Cash Cash & Equivalents Short Term Investments Total Receivables, Net Accounts Receivables - Trade, Net Total Inventory Prepaid Expenses Other Current Assets, Total Total Assets Property/Plant/Equipment, Total - Net Property/Plant/Equipment, Total - Gross Accumulated Depreciation, Total Goodwill, Net Intangibles, Net Long Term Investments Note Receivable - Long Term Other Long Term Assets, Total Other Assets, Total Total Current Liabilities Accounts Payable Payable/Accrued Accrued Expenses Notes Payable/Short Term Debt Current Port of LT Debt/Capital Leases Other Current liabilities, Total Total Liabilities Total Long Term Debt Long Term Debt Capital Lease Obligations Deferred Income Tax Minority Interest Other Liabilities, Total Total Equity Redeemable Preferred Stock, Total Preferred Stock - Non Redeemable, Net Common Stock, Total Additional Paid-In Capital Retained Earnings (Accumulated Deficit) Treasury Stock - Common ESOP Debt Guarantee Unrealized Gain (Loss) Other Equity, Total Total Liabilities & Shareholders' Equity Total Common Shares Outstanding Total Preferred Shares Outstanding Values in millions of AUD (except for per share items) 63.17 56.23 56.23 4.42 171.95 408.86 20.63 367.22 47.08 341.21 28.36 28.36 42.71 396.1 84.59 84.59 33.55 20.63 108.56 33.55 141.79 137.91 131.64 47.29 3199.88 68.64 1925.81 63.63 1849.06 62.17 1778.83 2651.22 1897.13 1895.86 1879.09 28.45 -47.15 -101.7 549.38 -2.65 1.93 3608.73 0.23 2293.03 596.89 0.35 2190.27 596.56 1.43 2174.93 586.92 757.27 Cash Flow Statement 2021 2019 2018 Period Ending: 30/06 30/06 12 Months 2020 30/06 12 Months 241.66 Period Length: 12 Months 30/06 12 Months 277.81 446.05 397.52 918.88 -397.91 485.64 -205.95 888.89 422.78 783.42 -457.65 Cash From Operating Activities Depreciation/Depletion Amortization Deferred Taxes Non-Cash Items Cash Receipts Cash Payments Cash Taxes Paid Cash Interest Paid Changes in Working Capital Cash From Investing Activities Capital Expenditures Other Investing Cash Flow Items, Total Cash From Financing Activities Financing Cash Flow Items Total Cash Dividends Paid Issuance (Retirement) of Stock, Net Issuance (Retirement) of Debt, Net Foreign Exchange Effects Net Change in Cash Values in millions of AUD (except for per share items) -3.28 -65.31 -115.34 -87.67 -27.67 -116.96 -7.9 -40.07 -105 -140.2 35.19 -68.88 -8.67 -66.24 -1064.97 -94.71 -970.26 633 -34.19 -29.54 760 -63.28 4.12 18.2 -1.03 -36.99 -136.85 -51.98 -84.87 600.17 -13.34 -29.54 703.35 -60.3 -29.16 675.82 -82.71 -11.74 -34.25 -3.11 162.1 -57.14 -1 102.92