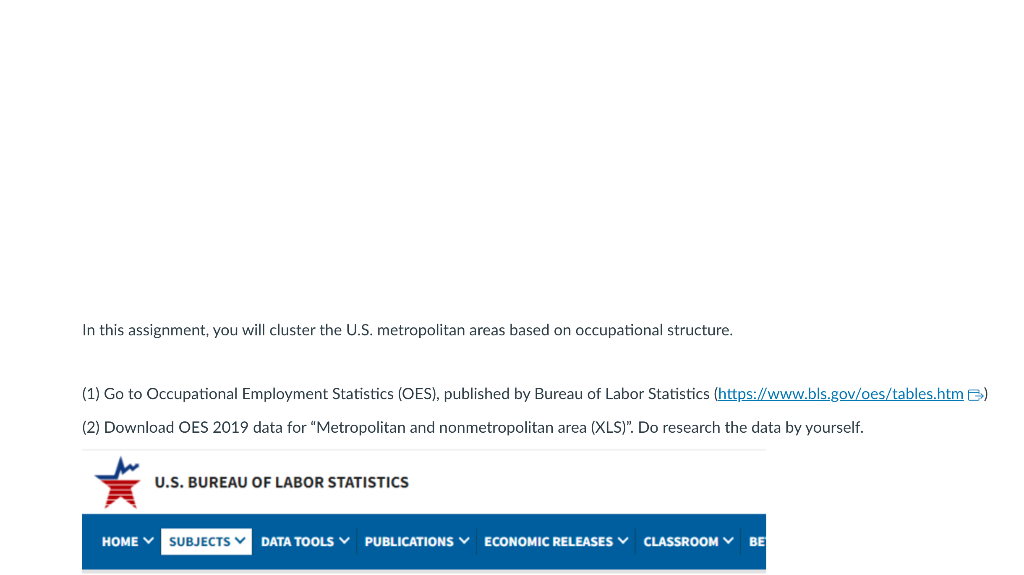
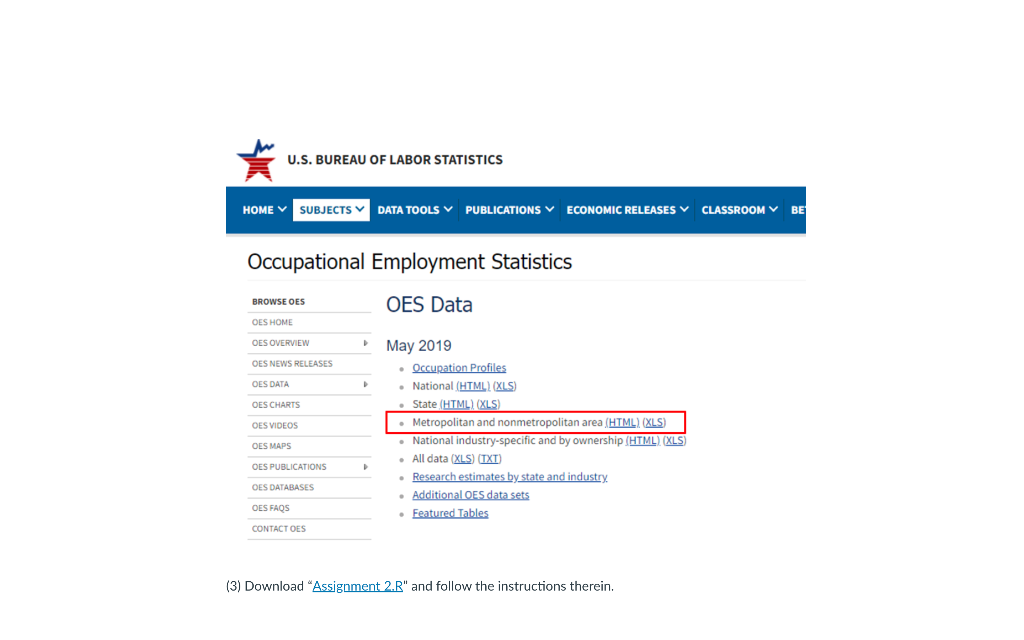
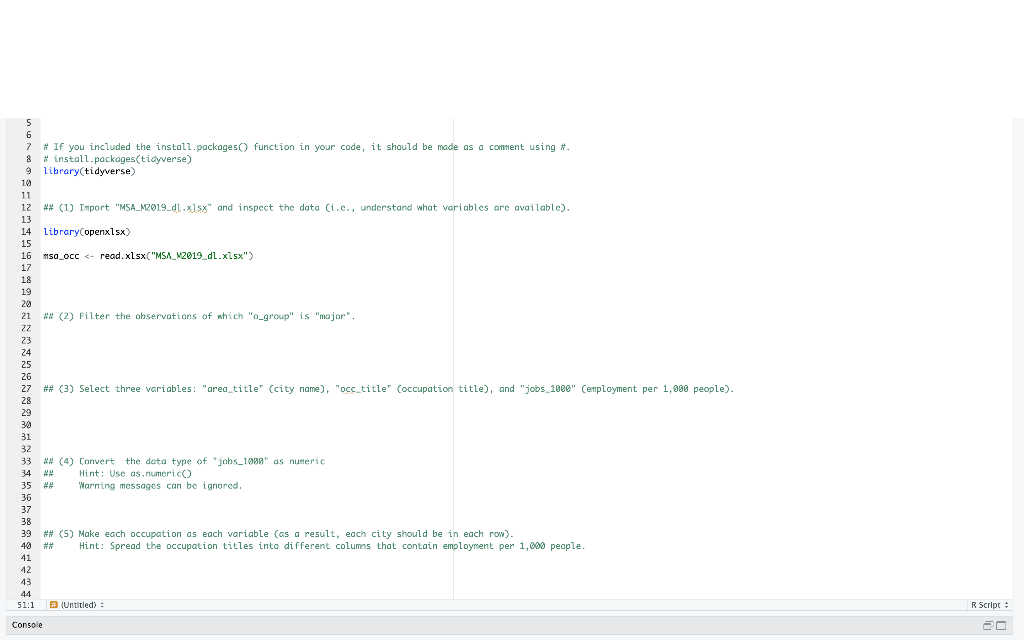
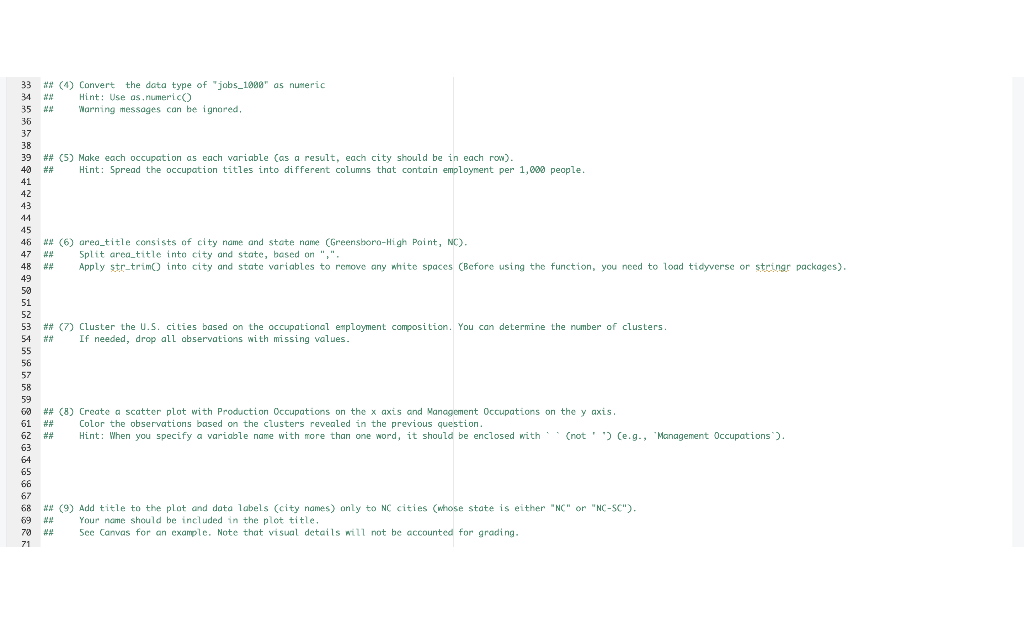
In this assignment, you will cluster the U.S. metropolitan areas based on occupational structure. (1) Go to Occupational Employment Statistics (OES), published by Bureau of Labor Statistics (https://www.bls.gov/oes/tables.htm B) (2) Download OES 2019 data for "Metropolitan and nonmetropolitan area (XLS)". Do research the data by yourself. Occupational Employment Statistics BROWSE OES OES Data May 2019 OES NEWS RELEASES - Occupation Profiles - National (HTMLL (XL.S) OES CHARTS - State (HTML) (XLS) - Metropolitan and nonmetropolitan area (HTML) (XLS) - National industry-specific and by ownership (HTML) (XLS) - All data (XLS) (TXT) - Research estimates by state and industry. - Additional OES data sets - Featured Tables (3) Download "Assignment 2.R and follow the instructions therein. \# If you included the install packagesO function in your code, it should be made as a contitent using. H install_packages(tidyverse) library(tidyverse) \#N (1) Import "MSA_MZo19_d], x].5x and inspect the data (i,c., understand what variables are available). library(openxlsx) msa_occ x axis and Management Occupations on the y axis. \#\# Color the observations based on the clusters revealed in the previous question. \#\# Hint: When you specify a variable name with more than one word, it should be enclosed with ' (not ") (e.g., 'Management Occupations'). H H (9) Add title to the plat and dota labels (city names) only to NC cities (whose state is either "NC" or "NC-SC"). 4.7 Your name should be included in the plot title. H\# See Canvas for an example. Note that visual details witl not be accounted for grading. In this assignment, you will cluster the U.S. metropolitan areas based on occupational structure. (1) Go to Occupational Employment Statistics (OES), published by Bureau of Labor Statistics (https://www.bls.gov/oes/tables.htm B) (2) Download OES 2019 data for "Metropolitan and nonmetropolitan area (XLS)". Do research the data by yourself. Occupational Employment Statistics BROWSE OES OES Data May 2019 OES NEWS RELEASES - Occupation Profiles - National (HTMLL (XL.S) OES CHARTS - State (HTML) (XLS) - Metropolitan and nonmetropolitan area (HTML) (XLS) - National industry-specific and by ownership (HTML) (XLS) - All data (XLS) (TXT) - Research estimates by state and industry. - Additional OES data sets - Featured Tables (3) Download "Assignment 2.R and follow the instructions therein. \# If you included the install packagesO function in your code, it should be made as a contitent using. H install_packages(tidyverse) library(tidyverse) \#N (1) Import "MSA_MZo19_d], x].5x and inspect the data (i,c., understand what variables are available). library(openxlsx) msa_occ x axis and Management Occupations on the y axis. \#\# Color the observations based on the clusters revealed in the previous question. \#\# Hint: When you specify a variable name with more than one word, it should be enclosed with ' (not ") (e.g., 'Management Occupations'). H H (9) Add title to the plat and dota labels (city names) only to NC cities (whose state is either "NC" or "NC-SC"). 4.7 Your name should be included in the plot title. H\# See Canvas for an example. Note that visual details witl not be accounted for grading