In this assignment you will use Excel formulas and charts to help a fast food restaurant evaluate the benefits of installing a kiosk in the lobby to automate customer orders, thus reducing the need for cashiers. An Excel template has been provided for you to use. A detailed description of the assignment, including an example, is included in the Excel Template titled: DA22.1 CVP.xlsx
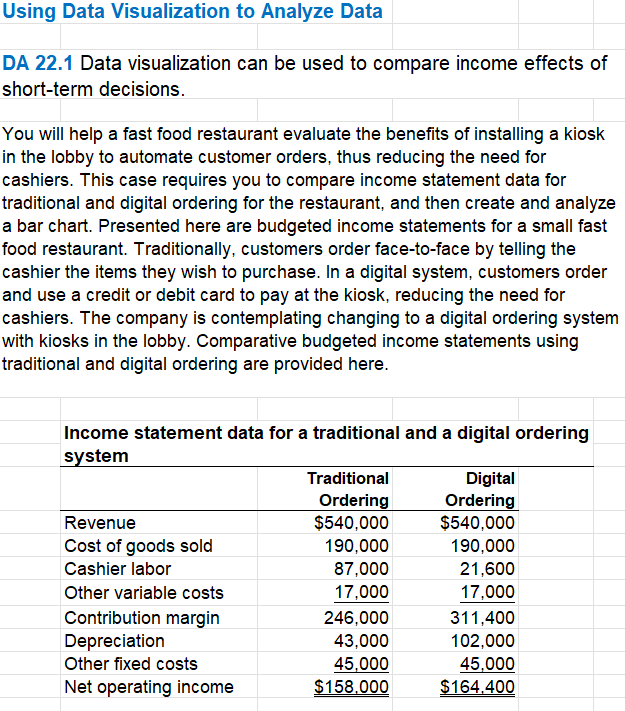
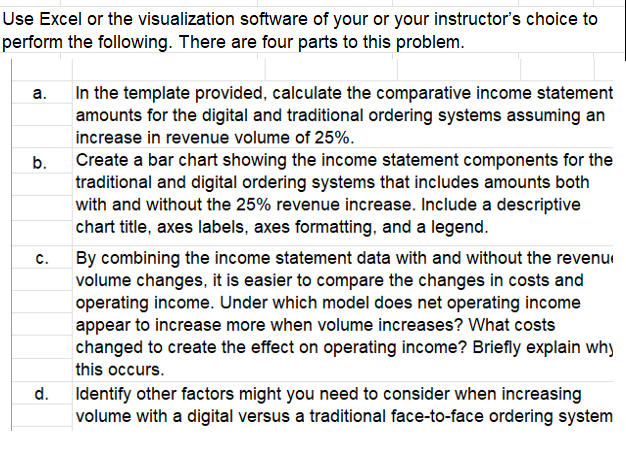
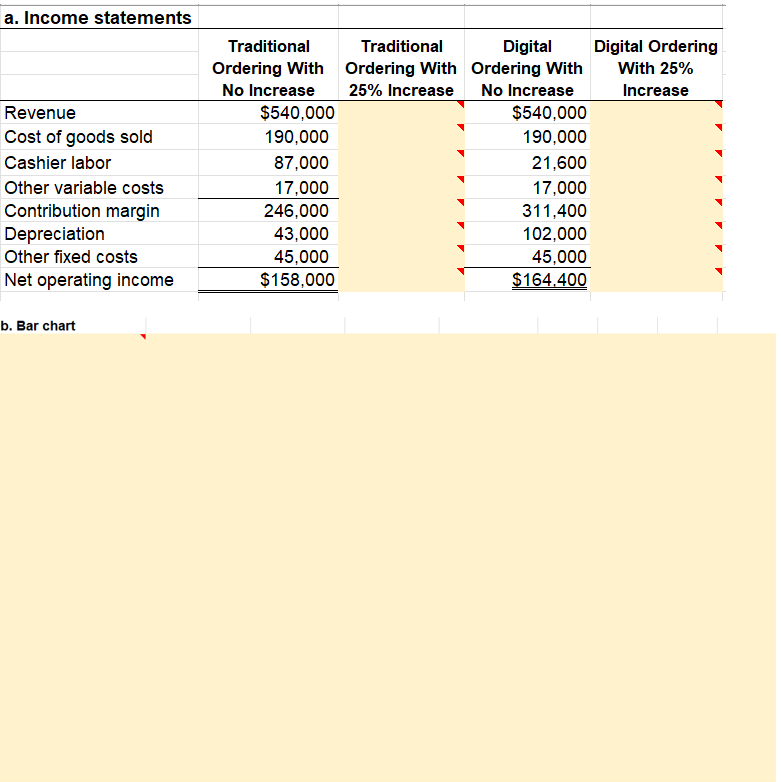
Using Data Visualization to Analyze Data DA 22.1 Data visualization can be used to compare income effects of short-term decisions. You will help a fast food restaurant evaluate the benefits of installing a kiosk in the lobby to automate customer orders, thus reducing the need for cashiers. This case requires you to compare income statement data for traditional and digital ordering for the restaurant, and then create and analyze a bar chart. Presented here are budgeted income statements for a small fast food restaurant. Traditionally, customers order face-to-face by telling the cashier the items they wish to purchase. In a digital system, customers order and use a credit or debit card to pay at the kiosk, reducing the need for cashiers. The company is contemplating changing to a digital ordering system with kiosks in the lobby. Comparative budgeted income statements using traditional and digital ordering are provided here. Income statement data for a traditional and a digital ordering system Traditional Digital Ordering Ordering Revenue $540,000 $540,000 Cost of goods sold 190,000 190,000 Cashier labor 87,000 21,600 Other variable costs 17,000 17,000 Contribution margin 246,000 311,400 Depreciation 43,000 102,000 Other fixed costs 45,000 45,000 Net operating income $158.000 $164.400 Use Excel or the visualization software of your or your instructor's choice to perform the following. There are four parts to this problem. a. In the template provided, calculate the comparative income statement amounts for the digital and traditional ordering systems assuming an increase in revenue volume of 25%. b. Create a bar chart showing the income statement components for the traditional and digital ordering systems that includes amounts both with and without the 25% revenue increase. Include a descriptive chart title, axes labels, axes formatting, and a legend. c. By combining the income statement data with and without the revenue volume changes, it is easier to compare the changes in costs and operating income. Under which model does net operating income appear to increase more when volume increases? What costs changed to create the effect on operating income? Briefly explain why this occurs. d. Identify other factors might you need to consider when increasing volume with a digital versus a traditional face-to-face ordering system a. Income statements Revenue Cost of goods sold Cashier labor Other variable costs Contribution margin Depreciation Other fixed costs Net operating income Traditional Traditional Digital Digital Ordering Ordering With Ordering With Ordering With With 25% No Increase 25% Increase No Increase Increase $540,000 $540,000 190,000 190,000 87,000 21,600 17,000 17,000 246,000 311,400 43,000 102,000 45,000 45,000 $158,000 $164.400 b. Bar chart c. Response d. Response Using Data Visualization to Analyze Data DA 22.1 Data visualization can be used to compare income effects of short-term decisions. You will help a fast food restaurant evaluate the benefits of installing a kiosk in the lobby to automate customer orders, thus reducing the need for cashiers. This case requires you to compare income statement data for traditional and digital ordering for the restaurant, and then create and analyze a bar chart. Presented here are budgeted income statements for a small fast food restaurant. Traditionally, customers order face-to-face by telling the cashier the items they wish to purchase. In a digital system, customers order and use a credit or debit card to pay at the kiosk, reducing the need for cashiers. The company is contemplating changing to a digital ordering system with kiosks in the lobby. Comparative budgeted income statements using traditional and digital ordering are provided here. Income statement data for a traditional and a digital ordering system Traditional Digital Ordering Ordering Revenue $540,000 $540,000 Cost of goods sold 190,000 190,000 Cashier labor 87,000 21,600 Other variable costs 17,000 17,000 Contribution margin 246,000 311,400 Depreciation 43,000 102,000 Other fixed costs 45,000 45,000 Net operating income $158.000 $164.400 Use Excel or the visualization software of your or your instructor's choice to perform the following. There are four parts to this problem. a. In the template provided, calculate the comparative income statement amounts for the digital and traditional ordering systems assuming an increase in revenue volume of 25%. b. Create a bar chart showing the income statement components for the traditional and digital ordering systems that includes amounts both with and without the 25% revenue increase. Include a descriptive chart title, axes labels, axes formatting, and a legend. c. By combining the income statement data with and without the revenue volume changes, it is easier to compare the changes in costs and operating income. Under which model does net operating income appear to increase more when volume increases? What costs changed to create the effect on operating income? Briefly explain why this occurs. d. Identify other factors might you need to consider when increasing volume with a digital versus a traditional face-to-face ordering system a. Income statements Revenue Cost of goods sold Cashier labor Other variable costs Contribution margin Depreciation Other fixed costs Net operating income Traditional Traditional Digital Digital Ordering Ordering With Ordering With Ordering With With 25% No Increase 25% Increase No Increase Increase $540,000 $540,000 190,000 190,000 87,000 21,600 17,000 17,000 246,000 311,400 43,000 102,000 45,000 45,000 $158,000 $164.400 b. Bar chart c. Response d. Response