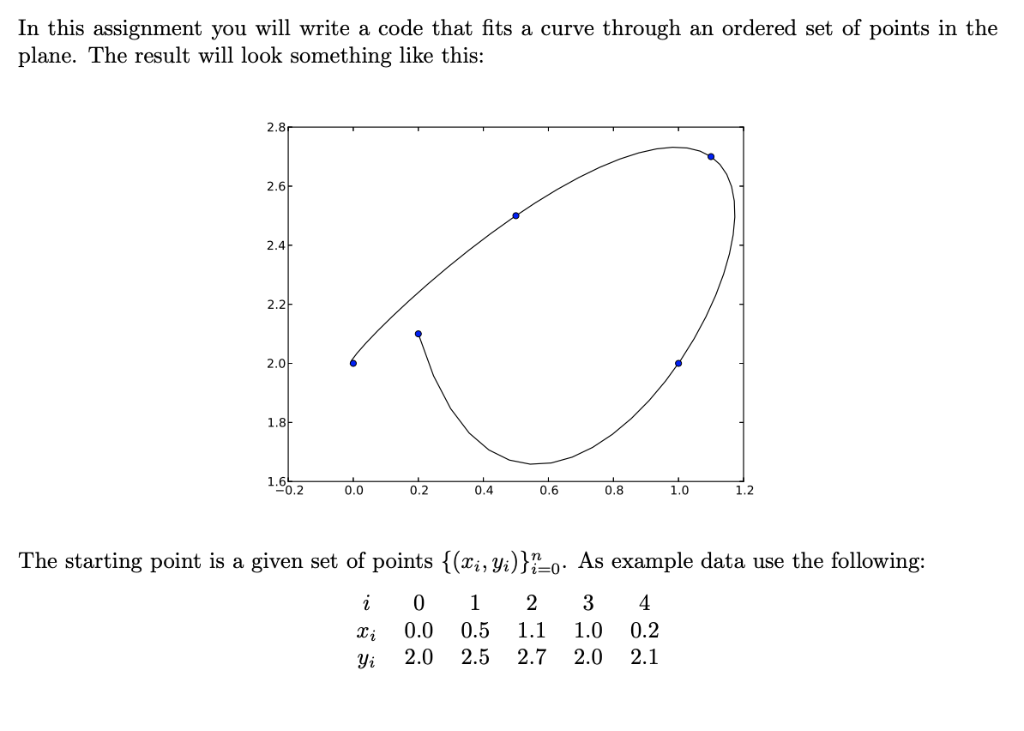
In this assignment you will write a code that fits a curve through an ordered set of points in the plane. The result will look something like this: 2.8 2.6 2.4 2.2 2.0 1.8 1.6 0.2 .0 0.2 0.4 0.6 0.8.0 1.2 The starting point is a given set of points {(xi yi))o- As example data use the following: 0.0 0.5 1.1 1.0 0.2 yi 2.0 2.5 2.7 2.0 2.1 You will use polynomial interpolation for this purpose. The task is to construct two polynomials, Pz (t) and Py(t), of order n, such that the curve is parameterized by t like this (x(t),y(t)) (Pa(t),py(t)) (a) First, write the pseudo-code for a function that sets the values of t at which to interpolate Use the Euclidean distance between the points for this purpose, i.e. Implement this in a Python function called set.t.values.py 10 marks (b) Now write the pseudo-code for a function that returns the polynomials pr and py for a given list of points ((xi,yi))P1 and parameters (ti)?-o Implement this in a Python function called construct pols.py. You can use the built-in function scipy.interpolate.lagrange or 10 marks the functions you programmed for tutorial 6 (c) Thirdly, write a script that sets the x and y values according to the table above, calls the functions from parts (a) and (b) to find the interpolating polynomials and plots the interpolating curve in the plane along with the interpolation points. Make sure to plot a smooth curve, not straight lines connecting the interpolation points. 10 marks Now add the following points to the list at the end: ((0.0,2.15), (-0.3,2.15)) You will see, that your interpolating curve does not resemble the data anymore. (d) Replace Lagrangian interpolation (i.e. fitting a high-order polynomial through all points) by piecewise interpolation (done by scipy.interpolate.interpld). If you use cubic splines, does the curve look better? Discuss the difference. fo mark For the pseudo-code, keep in mind the following rules it should clearly list and describe the inputs and outputs (significance, data type, dimensions), loops and conditionals should be clearly indicated, key words should not be specific to Python (e.g. avoid "for i in range (n+1)", instead indica write "for i from 1 to n"). In this assignment you will write a code that fits a curve through an ordered set of points in the plane. The result will look something like this: 2.8 2.6 2.4 2.2 2.0 1.8 1.6 0.2 .0 0.2 0.4 0.6 0.8.0 1.2 The starting point is a given set of points {(xi yi))o- As example data use the following: 0.0 0.5 1.1 1.0 0.2 yi 2.0 2.5 2.7 2.0 2.1 You will use polynomial interpolation for this purpose. The task is to construct two polynomials, Pz (t) and Py(t), of order n, such that the curve is parameterized by t like this (x(t),y(t)) (Pa(t),py(t)) (a) First, write the pseudo-code for a function that sets the values of t at which to interpolate Use the Euclidean distance between the points for this purpose, i.e. Implement this in a Python function called set.t.values.py 10 marks (b) Now write the pseudo-code for a function that returns the polynomials pr and py for a given list of points ((xi,yi))P1 and parameters (ti)?-o Implement this in a Python function called construct pols.py. You can use the built-in function scipy.interpolate.lagrange or 10 marks the functions you programmed for tutorial 6 (c) Thirdly, write a script that sets the x and y values according to the table above, calls the functions from parts (a) and (b) to find the interpolating polynomials and plots the interpolating curve in the plane along with the interpolation points. Make sure to plot a smooth curve, not straight lines connecting the interpolation points. 10 marks Now add the following points to the list at the end: ((0.0,2.15), (-0.3,2.15)) You will see, that your interpolating curve does not resemble the data anymore. (d) Replace Lagrangian interpolation (i.e. fitting a high-order polynomial through all points) by piecewise interpolation (done by scipy.interpolate.interpld). If you use cubic splines, does the curve look better? Discuss the difference. fo mark For the pseudo-code, keep in mind the following rules it should clearly list and describe the inputs and outputs (significance, data type, dimensions), loops and conditionals should be clearly indicated, key words should not be specific to Python (e.g. avoid "for i in range (n+1)", instead indica write "for i from 1 to n")