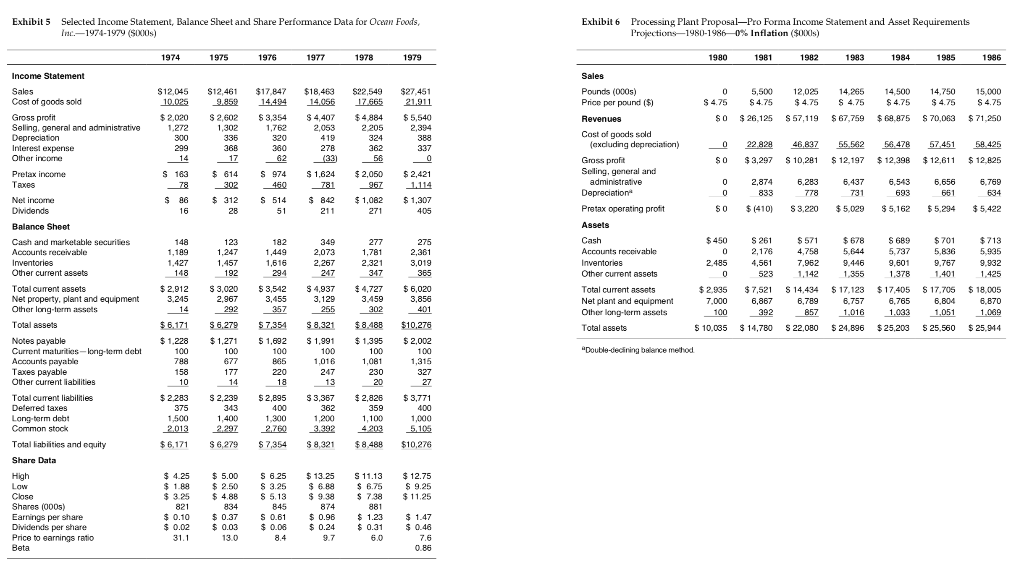
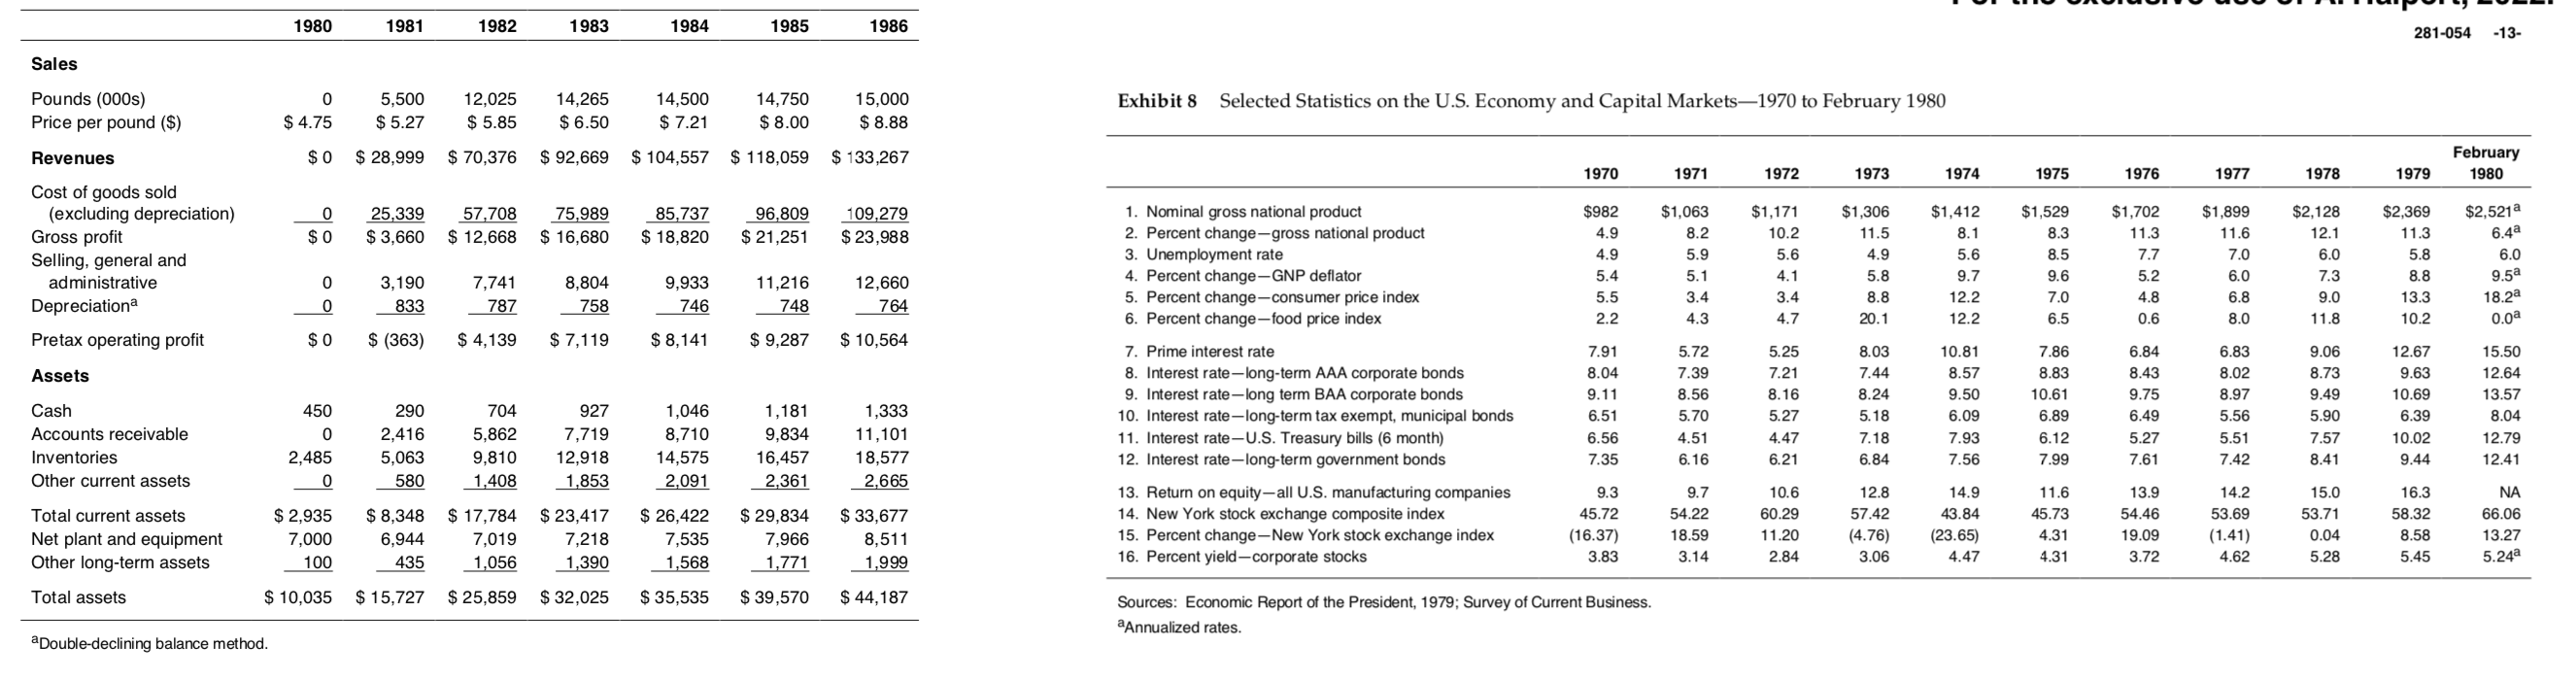
In this case, you have to decide whether the shrimp processing plant is a project that represents a worthwhile addition to Harris Seafoods. At this point in the course, we haven't incorporated a detailed discussion of financing policy and cost of capital. For this reason, I have divided the case into two parts. In this, the first part, we will concentrate on free cash flow estimation, as introduced in the core finance course and reviewed in this course. Later in the course, for the second part of this case, we will tackle the issue of financing strategy and the cost of capital. Assume that Time 0 is 1980. The (marginal) tax rate for Harris Seafoods is 48%. The project is financed entirely with excess cash. That is, ignore how financing choices could potentially affect the value of the project. We will return to this important issue later in the course. The cost of capital (i.e., the discount or hurdle rate) is 20%. Later in the course we will study how to estimate this rate more precisely. The tax credit of $650,000 that Harris Seafoods is expected to receive in 1981 can be ignored. Ignore tax loss carry forward/back, i.e., assume that if the project has negative taxable income in any year, these the resulting tax credits will offset the tax bill in the other divisions of Harris Sea Foods. Work with the 11% inflation scenario, that is what I will work with. Estimated free cash flows from operations for the years 0 through 6 can be found from a case exhibit, using the formulas in my slides. To estimate capital expenditures, use the balance sheet information for long term assets in the case exhibits and the identity (Book value) = (Book value)-1 - (Depreciation): + (Capex) Net working capital equals current assets less current liabilities. To estimate FCFs you need to find the changes in the non-cash part of NWC for each year, 0 through 7. Information about current assets can be found in a case exhibit while information about current liabilities can be found in the text of the case. You also have to estimate a terminal value for the project. You can use either a growth forecast for free cash flows or use comparables (preferably both and compare). For the growth forecast approach, think carefully about a reasonable growth forecast given the case information. For the comparables approach, you may want to use different multiples and see if they give you similar or dissimilar answers and then pick one for your basline projections. I do not need excel worksheets. I need a short (3-5) page document (could be you powerpoint or other slides) that contain your key exhibits with your FCF and TV projections,underlying assumptions and brief references to where in the case you found the relevant data (e.g., Exhibit 11, line 93). In preparing for class, you should make sure that you can answer the following questions and that you are ready to participate in a class discussion about the following issues. 1. Given the information available in the case, how would you calculate/estimate the free cash flows that we need to discount? Be prepared to specify & discuss the assumptions you have made in your approach. 2. Although the various estimates for the project end in 1986, the project will not be over by then. How would you account for this fact in your valuation? That is, can you think of methods that could be used to value the project ast 1986? 3. Use NPV to value the project. Is it a good project? Do you have any major caveats underlying your recommendation? Harris Seafoods, Inc. Charlie Harris, 54 years old, was chairman and chief executive officer of Harris Seafoods, Inc. The company had been founded by his father in 1935. Mr. Harris, Sr., had been in the lumber business in Savannah, Georgia. A shrimp boat builder to whom he had sold some lumber had gone into bankruptcy. As a result, he ended up owning two newly constructed shrimp boats. From that modest beginning, Harris Seafoods had evolved into one of the largest producers of frozen shrimp in the United States. Charlie Harris II, had taken over responsibility for operating the company in 1958 after a serious heart attack disabled his father. By 1979, the company had sales of slightly under $33 million, while profits after taxes were $7.8 million. The latter figure represented a 39% after-tax return on shareholder's equity. The high return on equity was achieved in spite of the fact that the company typically had a low percentage of debt in its capital structure. The company had issued shares publicly in 1967. Management still controlled 60% of the shares, but there was an active over-the-counter market for the stock. As of the end of 1979, there were two million shares outstanding. The total market value of the firm was $54 million. Data from the company's historical income statements and balance sheets are shown in Exhibit 1. The company had a fleet of over 100 boats which plied the waters between Texas and Mexico. Each boat had a built-in freezer. Every night, as soon as the shrimp were taken out of the nets, the shrimp were deheaded and flash frozen. On a typical trip, a boat stayed out 45 to 60 days before returning to port. a Harris Seafoods' in-shore facilities included a dock and packing plant where the shrimp were unloaded, graded by size and quality, and put into 5 lb. containers. In turn, the 5 lb. containers were placed in 50 lb. cartons for shipment to a local cold storage plant from which the firm leased space. The shrimp were distributed through a captive sales organization. Roughly 40% of sales were made to wholesalers along the east coast of the United States. The wholesalers sold the shrimp to retail establishments (e.g., supermarket chains and retail fish stores) and institutional outlets (e.g., restaurants, hospitals and industrial cafeterias). Another 35% of sales were made to Japanese trading companies. The remaining sales were to processors. Processors converted the raw shrimp into an intermediate product such as pre-cooked or breaded shrimp. In turn, the processors sold their products to the same mix of outlets as that described above (i.e., retail and institutional establishments). storage was fairly expensive. Data on the demand, supply, and average price of shrimp are shown in Exhibit 2 Harris Seafoods sold its product under the SHRIMP KING brand name. Harris Seafoods was known for its high-quality product and superb customer service. The SHRIMP KING brand commanded a price premium of $0.10 to $0.15 per pound over competitive brands. In the past, it was frequently the case that demand exceeded supply, and sales had to be ratione among customers. The Shrimp Industry On the cost side, the largest and most uncertain element of cost was fuel expense for operating the boats. Since 1973, the cost of fuel had increased from 15% of cost of goods sold to 27%. Better engine fuel efficiency had helped, but still the problem persistedi. All in all, ther, the shrimp business was risky. Remarkably, however, Harris Seafoods had never reported a loss in its 45 years of operation. Considering how many of its competitors had been forced into bankruptcy, that was an enviable record The Processing Plant Proposal Harris Seafoods had been phenomenally successful when judged in terms of average profitability. However, the business was not without its risks. There were two principal sources of risk: first, the supply of shrimp both for Harris Seafoods and for the entire industry was uncertain and, second, the demand for shrimp was uncertain. The shrimp consumed in each year came from three sources: domestic production, net imports, and beginning inventories. With regard to domestic production, the shrimp beds in the waters off Texas and Mexico were overfished. As a result, it was becoming increasingly difficult to find shrimp. Also, in any given year, the size and value of the catch were affected by events beyond the control of management. When there was too much rain, for example, the level of production was adversely affected. Weather could also affect the size composition of the catch since the price received for shrimp depended on the size dass, but cost did not the percent of large shrimp in the catch was a critical determinant of profitability, Another contributor to uncertainty about the supply of shrimp was that the dramatic increase in offshore drilling activity in the 1970s had brought a commensurate increase in the risk of oil spills. Some shrimping grounds were in danger of being destroyed Further, Mexico, and indeed most of the countries of the world, had established 200-mile territorial boundaries. The number of foreign registered boats allowed to fish in Mexican waters had heen sharply limited. This was most unfortunate since a high proportion of the shrimp catch came froen waters within Mexican territorial limits. Harris Seafoods had been successful in part because it had established and maintained good relations with the Mexican government Management believed they were less vulnerable than some of their eximpetitors to a tightening of the Mexican fishing a regulations. Nevertheless, the threat existed. Finally, the level of imports into the United States fluctuated from year to year. Foreign competitors tended to have lower costs than U.S. fishermen, and charges of dumping were frequently heard." Over the years, Harris Seafoods had considered a number of proposals to expand into businesses other than shrimp production and sales. In 1975, for example, the company had entered the lobster business. Approximately 15 hoats were purchased and outfitted. The fishing grounds were in the Caribbean Sea south of the Cayman Islands. The return on investment did not live up to expectations, and the boats were refitted to catch shrimp one year after the experiment began. In late 1979, Mr. Harris had unsuccessfully attempted to acquire a local, privately held shrimp processing operation. The company had sales of S23 million, and net profits of $1.9 million. The owner of the company tumed down an offer of SID million in cash, with an additional SIO million to be paid based on future performance. When the acquisition attempt tell through, Mr. Harris decided that Harris Seafoods should consider building its own processing facility. The business seemed quite attractive both in terms of growth and in terms of retum on investment. And, there were some obvious opportunities, especially in the sales area, for the company to utilize its resources more effectively. The Shrimp Processing Industry Shrimp processors purchased raw shrimp and converted them into some intermediate or final product For example, raw shrimp generally were purchased with their heads off but the shells intact. A typical processing operation would be to clean (de-shell and de- vein) the shrimp. The output would either be repackaged for sale (eg, frozen individually and put into 2 lb. bags) or further processed. The most frequent processing operation entailed adding a batter to cach shrimp (called breading). The breaded shrimp were then frozen, packaged, and distributed With regard to consumption, the demand for shrimp was strongly affected by cyclical swings in the economy. One of the reasons Harris Seafoods had decided to export to Japan was that doing so dampened the cyclical swings in its business The price of shrimp thus depended on many factors, few of which were under the control of management First, there were price swings brought about by changes in the state of the economy. Since shrimp were a luxury good, the demand for shrimp was particularly sensitive to swings in the eccenomy. Then, there were price changes brought about by changes in supply. Rarely were supply and demand for shrimp synchronized Shrimp could be put into cold storage for up to one year with na damage, but holding shrimp off the market did not eliminate dramatic price swings. And cold Sales of processed shrimp products had grown at relatively high rates over the past 10 years By 1979, total sales of all (fresh, frozen and processed) shrimp products were $3.6 billion. This represented almost 50% of total seafood sales in the United States. Indeed, both the share of total consumer food purchases represented by seafood and the share of total seafood expenditures represented by shrimp had increased dramatically during the decade of the 1970s. Shrimp had become a luxury good, and demand had held up in spite of price rises well in excess of general inflation. (See Exhibit 3 for yearly figures on sales of sluimp.) There were no dominant competitors in the shrimp processing industry. The largest company (Singleton Shrimp Company) had 1979 sales of under SRO million. There were about five other processors whose sales exceeded $30 million. It was somewhat difficult to get accurate data on sales and profitability of the various competitors because most were privately owned. However, Harris Seafoods was not particularly vulnerable to import competition because the hull of morts were in the there were two publicly traded companies-Treasure Isle, Inc. and Ocean Foods, Inc. Summary data from the income statements and balance sheets for these two companies are shown in Exhibits 4 and 5. According to Dun and Bradstreet reports, the other large companies in the industry were reasonably profitable Mr. Harris had talked to two extremely capable people who ran processing operations for competitors. Both had expressed a strong interest in working for Harris Seafoods if the plant were built. Operating and Financial Information Regarding the Shrimp Processing Plant Mr. Harris's staff had determined that it would cost about $7.0 million to build an efficient- size processing plant. If construction were begun in the first quarter of 1980, the plant could be finished by the beginning of 1981. The plant would be located on land which was owned by the City of Brownsville, Texas, and which would be leased to Harris Seafoods for 99 years at a nominal cost. However, the company would have to pay property taxes at the normal commercial rate. The company could also lease cold storage space at Gulf Coast Cold Storage. The latter would have to expand its facilities at a cost of approximately $131,000, but had agreed to do so at its own expense if the plant were built. Pro forma data for the processing plant are shown in Exhibits 6 and 7. The data in Exhibit 6 are not inflated. The assumption is made in Exhibit 7 that the annual inflation rate will be 11%. The first sales for the processing plant were not expected to begin until 1981. The tax rate on income from the project was expected to be 48% (the combined US federal and Texas state tax rate). Any profits or losses from the project would be consolidated for tax purposes with the parent company's income statement. Also, in 1981, Harris Seafoods expected to receive a $650,000 tax credit for the investment in plant and equipment at the processing plant. The funds nexessary to finance the project were expected to come from two sources: (1) current liabilities which were generated in the normal course of business cg, accounts payable; and (2) investment of funds by the parent company. Current liabilities of the processing plant, comprised of accounts payable, taxes payable, and miscellaneous current liabilities, were expected to be 9% of total sales. This figure was low principally because processors had to pay cash for shrimp at most times during the year. Mr. Harris had been informed by the company's investment bankers that the company's effective interest cost on newly issued long-term debt would be 13.5%. The debt would be retired in equal installments over a 12-year period from the time of issue. The raw shrimp to be processed at the plant were to be purchased on the open market. There was a possibility that some Harris Seafoods product would be sold to the plant, but given the fact that demand exceeded supply for the shrimp company, few intercompany sales were contemplated The principal product to be produced was breaded shrimp. There were quite favorable projections for this part of the total shrimp market, particularly given the fact that breaded shrimp were significantly less expensive than frozen shrimp when measured on a per-pound basis. The cntire process was automated: machines sorted, pecled, devcined, breaded and packaged the shrimp in a continuous production line. Generally the breading materials (eggs, milk and ground crackers) were equal in weight to the raw shrimp. However, if the cost of raw Shrimp purchased on the open market by Harris Seafoods were $4.31 per pound, the cost to purchase the breading materials would only average 50.50 per pound of materials purchased. Marketing would be done by the existing Harris Seafoods sales organizacion. There were three kinds of customers: a Over the long run, Mr. Harris believed total debt (notes payable plus current maturities of long-term debt plus long-term debt) should not exceed 30% of total invested capital (total debt plus shareholders' equity) of the firm. There was a possibility that Harris Seafoods would be able to issue $7.0 million of 12-year maturity Industrial Revenue Bondst to fund the investment in property, plant, and equipment in the processing plant. These bonds would be amortized in equal installments over the 12-year life of the bond. The interest rate was expected to be 9.5%. Income on this kind of bond was not taxable to the buyer of the bond, but was tax deductible by the issuer. Though the bond would technically be issued by the municipality of Brownsville, Texas, the payment of interest and the repayment of principal would be made and guaranteed by Harris Seafoods. 1. Food service brokers-these called on institutional food service companies, national fast food chains and large schools and hospitals The Issues 2. Retail brokers-these sold to retail outlets such as grocery stores and supermarket chains Mr. Harris thought the project looked attractive, but was concemed that accepting it might reduce the company's high rate of return on invested capital. He also wondered how important the ability to issue the Industrial Revenue Bonds was to the value of the project. 3. Direct salesthe company felt it could bypass other distributors and sell directly to national restaurant food chains such as Arthur Treacher, Long John Silver and Morrison's Cafeteria. The combined usage of processed shrimp by these three organizations alone had been 8.5 million pounds in 1979, In the early years, it would be necessary to invest heavily in advertising and marketing. The brand image of the product was an essential contributor to success When operating at full capacity, the plant would be capable of producing 15 million pounds of product per year. At full capacity, the labor force required would total 400. The initial production and sales plan called for first-year manning of 300 workers, virtually all of whom would receive minimum wage Sales in the first year were projected to be 55 million pounds (37% of capacity). Within five years, it was expected that sales and the labor force would move toward the upper limits. 3 As of late February 1980, the prime rate was 15.5%. If Harris Seafoods borrowed from the banks, the effective cost of funds would be 16%. (See Exhibits for some data del recent trends in the economy and capital markets.) in order to encourage companies to invest in a local community, the municipality sometimes allowed firms to issue tax-exempt municipal bonds in an amount equal to the value of the investment in property, plant and equipment. The firms would pay interest at the rate appropriate for tax-exempt bonds rather than at the higher rate appropriate for bonds paying interest that represented taxable income to the buyer. The tax-exempt nature of the interest payments on Industrial Revenue Bands produced a significant loss of revenue for the US. 1975 1976 1977 1978 1979 Exhibit 2 Beginning Domestic u Ending Apparent Raw Shrimp Pounds Consumed $8282 $10.26 $4,045 $8,404 $8.95 $8.867 $5.975 $15.08 de 1.174 308 1.221 089851412140154 $5.00 SSES 518 2422 2.078 2.104.60 5 1,767 $1,650 $3.486 53.282 $2,978 57.810 18454 3 SRS NESPRESS ANN NA os 268) 89 1,905 3,282 2813 4,218 $4.00 sa v t 6,421 7.402 11.016121162 San 310.00 $13.002515.809 510.046 $20.08 $ 2,662 $2,007 5214 3 2013 $ 1,007 40 CATE $3.788 $4.31 1,345 1.433 1.807 2.626 $10.00 $13.00 1587 519545 SUVUN $27.204 Total still do Share Data un & OS TAS AB SON 8888894 Exhibit 3 * # m # # EE en and breathe 7: 1 5 12.149 514.277 $22.180 1.rn 24t# Fuaw1 Fss. 64 65 66 red chum calorias, god # # & # # Poin # in 9 # # # # 02 ent and Asset Requirements $3,297 2,874 $ (410) 2,178 4,561 so 0 S4.75 2.485 Exhibito Processing Plant Proposal Pro Forma Income Projections1980-19860% Inflation ($OOXIS) 2.935 EE 8 GS * $ - Fa * #*#*##* * FF * # # 11a * p 7 012 0 $ 6,171 $6.279 S7854 % * 301 B 1.427 $2.912 $6.171 $ 1.228 * Exhibits Selected Income Statement -one-dela Income Statement Cost of goods sold Sales Gross profit Notes payable Share Data 1980 1981 1982 1983 1984 1985 1986 281-054 -13- Sales Exhibit 8 Pounds (000s) Price per pound ($) 0 $ 4.75 5,500 $ 5.27 12,025 $ 5.85 14,265 $ 6.50 14,500 $ 7.21 14,750 $ 8.00 15,000 $ 8.88 Selected Statistics on the U.S. Economy and Capital Markets1970 to February 1980 Revenues $0 $ 28,999 $ 70,376 $ 92,669 $ 104,557 $ 118,059 $ 133,267 February 1980 1970 1971 1972 1973 1974 1975 1976 1977 1978 1979 0 $0 25.339 $ 3,660 57,708 75,989 $ 12,668 $ 16,680 85,737 $ 18,820 96,809 $ 21,251 109,279 $ 23,988 Cost of goods sold (excluding depreciation) Gross profit Selling, general and administrative Depreciation $982 4.9 4.9 5.4 5.5 2.2 $1,063 8.2 5.9 5.1 3.4 4.3 $1,171 10.2 5.6 4.1 3.4 4.7 $1,306 11.5 4.9 5.8 8.8 20.1 $1,412 8.1 5.6 9.7 12.2 12.2 $1,529 8.3 8.5 9.6 7.0 6.5 $1,702 11.3 7.7 5.2 4.8 0.6 $1,899 11.6 7.0 6.0 6.8 8.0 $2,128 12.1 6.0 7.3 9.0 11.8 $2,369 11.3 5.8 8.8 13.3 10.2 $2,521a 6.4a 6.0 9.5a 18.20 0.00 0 0 3,190 833 7,741 787 8,804 758 9,933 746 11,216 748 12,660 764 Pretax operating profit $0 $ (363) $ 4,139 $ 7,119 $ 8,141 $ 9,287 $ 10,564 1. Nominal gross national product 2. Percent change-gross national product 3. Unemployment rate 4. Percent change-GNP deflator 5. Percent change-consumer price index 6. Percent change-food price index 7. Prime interest rate 8. Interest rate-long-term AAA corporate bonds 9. Interest rate-long term BAA corporate bonds 10. Interest rate-long-term tax exempt, municipal bonds 11. Interest rate-U.S. Treasury bills (6 month) 12. Interest rate-long-term government bonds 8.03 Assets 7.44 Cash Accounts receivable Inventories Other current assets 450 0 2,485 0 290 2,416 5,063 580 704 5,862 9,810 1,408 927 7,719 12,918 1,853 1,046 8,710 14,575 2,091 1,181 9,834 16,457 2,361 1,333 11,101 18,577 2,665 7.91 8.04 9.11 6.51 6.56 7.35 5.72 7.39 8.56 5.70 4.51 6.16 5.25 7.21 8.16 5.27 4.47 6.21 8.24 5.18 7.18 6.84 10.81 8.57 9.50 6.09 7.93 7.56 7.86 8.83 10.61 6.89 6.12 7.99 6.84 8.43 9.75 6.49 5.27 7.61 6.83 8.02 8.97 5.56 5.51 7.42 9.06 8.73 9.49 5.90 7.57 8.41 12.67 9.63 10.69 6.39 10.02 9.44 15.50 12.64 13.57 8.04 12.79 12.41 Total current assets Net plant and equipment Other long-term assets $ 2,935 7,000 100 $ 8,348 6,944 435 $ 17,784 7,019 1,056 $ 23,417 7,218 1,390 $ 26,422 7,535 1,568 $ 29,834 7,966 1,771 $ 33,677 8,511 1,999 13. Return on equity-all U.S. manufacturing companies 14. New York stock exchange composite index 15. Percent change-New York stock exchange index 16. Percent yield-corporate stocks 9.3 45.72 (16.37) 3.83 9.7 54.22 18.59 3.14 10.6 60.29 11.20 12.8 57.42 (4.76) 3.06 14.9 43.84 (23.65) 11.6 45.73 4.31 4.31 13.9 54.46 19.09 3.72 14.2 53.69 (1.41) 4.62 15.0 53.71 0.04 5.28 16.3 58.32 8.58 5.45 NA 66.06 13.27 5.24a 2.84 4.47 Total assets $ 10,035 $ 15,727 $ 25,859 $ 32,025 $ 35,535 $ 39,570 $ 44,187 Sources: Economic Report of the President, 1979; Survey of Current Business. a Annualized rates. aDouble-declining balance method. In this case, you have to decide whether the shrimp processing plant is a project that represents a worthwhile addition to Harris Seafoods. At this point in the course, we haven't incorporated a detailed discussion of financing policy and cost of capital. For this reason, I have divided the case into two parts. In this, the first part, we will concentrate on free cash flow estimation, as introduced in the core finance course and reviewed in this course. Later in the course, for the second part of this case, we will tackle the issue of financing strategy and the cost of capital. Assume that Time 0 is 1980. The (marginal) tax rate for Harris Seafoods is 48%. The project is financed entirely with excess cash. That is, ignore how financing choices could potentially affect the value of the project. We will return to this important issue later in the course. The cost of capital (i.e., the discount or hurdle rate) is 20%. Later in the course we will study how to estimate this rate more precisely. The tax credit of $650,000 that Harris Seafoods is expected to receive in 1981 can be ignored. Ignore tax loss carry forward/back, i.e., assume that if the project has negative taxable income in any year, these the resulting tax credits will offset the tax bill in the other divisions of Harris Sea Foods. Work with the 11% inflation scenario, that is what I will work with. Estimated free cash flows from operations for the years 0 through 6 can be found from a case exhibit, using the formulas in my slides. To estimate capital expenditures, use the balance sheet information for long term assets in the case exhibits and the identity (Book value) = (Book value)-1 - (Depreciation): + (Capex) Net working capital equals current assets less current liabilities. To estimate FCFs you need to find the changes in the non-cash part of NWC for each year, 0 through 7. Information about current assets can be found in a case exhibit while information about current liabilities can be found in the text of the case. You also have to estimate a terminal value for the project. You can use either a growth forecast for free cash flows or use comparables (preferably both and compare). For the growth forecast approach, think carefully about a reasonable growth forecast given the case information. For the comparables approach, you may want to use different multiples and see if they give you similar or dissimilar answers and then pick one for your basline projections. I do not need excel worksheets. I need a short (3-5) page document (could be you powerpoint or other slides) that contain your key exhibits with your FCF and TV projections,underlying assumptions and brief references to where in the case you found the relevant data (e.g., Exhibit 11, line 93). In preparing for class, you should make sure that you can answer the following questions and that you are ready to participate in a class discussion about the following issues. 1. Given the information available in the case, how would you calculate/estimate the free cash flows that we need to discount? Be prepared to specify & discuss the assumptions you have made in your approach. 2. Although the various estimates for the project end in 1986, the project will not be over by then. How would you account for this fact in your valuation? That is, can you think of methods that could be used to value the project ast 1986? 3. Use NPV to value the project. Is it a good project? Do you have any major caveats underlying your recommendation? Harris Seafoods, Inc. Charlie Harris, 54 years old, was chairman and chief executive officer of Harris Seafoods, Inc. The company had been founded by his father in 1935. Mr. Harris, Sr., had been in the lumber business in Savannah, Georgia. A shrimp boat builder to whom he had sold some lumber had gone into bankruptcy. As a result, he ended up owning two newly constructed shrimp boats. From that modest beginning, Harris Seafoods had evolved into one of the largest producers of frozen shrimp in the United States. Charlie Harris II, had taken over responsibility for operating the company in 1958 after a serious heart attack disabled his father. By 1979, the company had sales of slightly under $33 million, while profits after taxes were $7.8 million. The latter figure represented a 39% after-tax return on shareholder's equity. The high return on equity was achieved in spite of the fact that the company typically had a low percentage of debt in its capital structure. The company had issued shares publicly in 1967. Management still controlled 60% of the shares, but there was an active over-the-counter market for the stock. As of the end of 1979, there were two million shares outstanding. The total market value of the firm was $54 million. Data from the company's historical income statements and balance sheets are shown in Exhibit 1. The company had a fleet of over 100 boats which plied the waters between Texas and Mexico. Each boat had a built-in freezer. Every night, as soon as the shrimp were taken out of the nets, the shrimp were deheaded and flash frozen. On a typical trip, a boat stayed out 45 to 60 days before returning to port. a Harris Seafoods' in-shore facilities included a dock and packing plant where the shrimp were unloaded, graded by size and quality, and put into 5 lb. containers. In turn, the 5 lb. containers were placed in 50 lb. cartons for shipment to a local cold storage plant from which the firm leased space. The shrimp were distributed through a captive sales organization. Roughly 40% of sales were made to wholesalers along the east coast of the United States. The wholesalers sold the shrimp to retail establishments (e.g., supermarket chains and retail fish stores) and institutional outlets (e.g., restaurants, hospitals and industrial cafeterias). Another 35% of sales were made to Japanese trading companies. The remaining sales were to processors. Processors converted the raw shrimp into an intermediate product such as pre-cooked or breaded shrimp. In turn, the processors sold their products to the same mix of outlets as that described above (i.e., retail and institutional establishments). storage was fairly expensive. Data on the demand, supply, and average price of shrimp are shown in Exhibit 2 Harris Seafoods sold its product under the SHRIMP KING brand name. Harris Seafoods was known for its high-quality product and superb customer service. The SHRIMP KING brand commanded a price premium of $0.10 to $0.15 per pound over competitive brands. In the past, it was frequently the case that demand exceeded supply, and sales had to be ratione among customers. The Shrimp Industry On the cost side, the largest and most uncertain element of cost was fuel expense for operating the boats. Since 1973, the cost of fuel had increased from 15% of cost of goods sold to 27%. Better engine fuel efficiency had helped, but still the problem persistedi. All in all, ther, the shrimp business was risky. Remarkably, however, Harris Seafoods had never reported a loss in its 45 years of operation. Considering how many of its competitors had been forced into bankruptcy, that was an enviable record The Processing Plant Proposal Harris Seafoods had been phenomenally successful when judged in terms of average profitability. However, the business was not without its risks. There were two principal sources of risk: first, the supply of shrimp both for Harris Seafoods and for the entire industry was uncertain and, second, the demand for shrimp was uncertain. The shrimp consumed in each year came from three sources: domestic production, net imports, and beginning inventories. With regard to domestic production, the shrimp beds in the waters off Texas and Mexico were overfished. As a result, it was becoming increasingly difficult to find shrimp. Also, in any given year, the size and value of the catch were affected by events beyond the control of management. When there was too much rain, for example, the level of production was adversely affected. Weather could also affect the size composition of the catch since the price received for shrimp depended on the size dass, but cost did not the percent of large shrimp in the catch was a critical determinant of profitability, Another contributor to uncertainty about the supply of shrimp was that the dramatic increase in offshore drilling activity in the 1970s had brought a commensurate increase in the risk of oil spills. Some shrimping grounds were in danger of being destroyed Further, Mexico, and indeed most of the countries of the world, had established 200-mile territorial boundaries. The number of foreign registered boats allowed to fish in Mexican waters had heen sharply limited. This was most unfortunate since a high proportion of the shrimp catch came froen waters within Mexican territorial limits. Harris Seafoods had been successful in part because it had established and maintained good relations with the Mexican government Management believed they were less vulnerable than some of their eximpetitors to a tightening of the Mexican fishing a regulations. Nevertheless, the threat existed. Finally, the level of imports into the United States fluctuated from year to year. Foreign competitors tended to have lower costs than U.S. fishermen, and charges of dumping were frequently heard." Over the years, Harris Seafoods had considered a number of proposals to expand into businesses other than shrimp production and sales. In 1975, for example, the company had entered the lobster business. Approximately 15 hoats were purchased and outfitted. The fishing grounds were in the Caribbean Sea south of the Cayman Islands. The return on investment did not live up to expectations, and the boats were refitted to catch shrimp one year after the experiment began. In late 1979, Mr. Harris had unsuccessfully attempted to acquire a local, privately held shrimp processing operation. The company had sales of S23 million, and net profits of $1.9 million. The owner of the company tumed down an offer of SID million in cash, with an additional SIO million to be paid based on future performance. When the acquisition attempt tell through, Mr. Harris decided that Harris Seafoods should consider building its own processing facility. The business seemed quite attractive both in terms of growth and in terms of retum on investment. And, there were some obvious opportunities, especially in the sales area, for the company to utilize its resources more effectively. The Shrimp Processing Industry Shrimp processors purchased raw shrimp and converted them into some intermediate or final product For example, raw shrimp generally were purchased with their heads off but the shells intact. A typical processing operation would be to clean (de-shell and de- vein) the shrimp. The output would either be repackaged for sale (eg, frozen individually and put into 2 lb. bags) or further processed. The most frequent processing operation entailed adding a batter to cach shrimp (called breading). The breaded shrimp were then frozen, packaged, and distributed With regard to consumption, the demand for shrimp was strongly affected by cyclical swings in the economy. One of the reasons Harris Seafoods had decided to export to Japan was that doing so dampened the cyclical swings in its business The price of shrimp thus depended on many factors, few of which were under the control of management First, there were price swings brought about by changes in the state of the economy. Since shrimp were a luxury good, the demand for shrimp was particularly sensitive to swings in the eccenomy. Then, there were price changes brought about by changes in supply. Rarely were supply and demand for shrimp synchronized Shrimp could be put into cold storage for up to one year with na damage, but holding shrimp off the market did not eliminate dramatic price swings. And cold Sales of processed shrimp products had grown at relatively high rates over the past 10 years By 1979, total sales of all (fresh, frozen and processed) shrimp products were $3.6 billion. This represented almost 50% of total seafood sales in the United States. Indeed, both the share of total consumer food purchases represented by seafood and the share of total seafood expenditures represented by shrimp had increased dramatically during the decade of the 1970s. Shrimp had become a luxury good, and demand had held up in spite of price rises well in excess of general inflation. (See Exhibit 3 for yearly figures on sales of sluimp.) There were no dominant competitors in the shrimp processing industry. The largest company (Singleton Shrimp Company) had 1979 sales of under SRO million. There were about five other processors whose sales exceeded $30 million. It was somewhat difficult to get accurate data on sales and profitability of the various competitors because most were privately owned. However, Harris Seafoods was not particularly vulnerable to import competition because the hull of morts were in the there were two publicly traded companies-Treasure Isle, Inc. and Ocean Foods, Inc. Summary data from the income statements and balance sheets for these two companies are shown in Exhibits 4 and 5. According to Dun and Bradstreet reports, the other large companies in the industry were reasonably profitable Mr. Harris had talked to two extremely capable people who ran processing operations for competitors. Both had expressed a strong interest in working for Harris Seafoods if the plant were built. Operating and Financial Information Regarding the Shrimp Processing Plant Mr. Harris's staff had determined that it would cost about $7.0 million to build an efficient- size processing plant. If construction were begun in the first quarter of 1980, the plant could be finished by the beginning of 1981. The plant would be located on land which was owned by the City of Brownsville, Texas, and which would be leased to Harris Seafoods for 99 years at a nominal cost. However, the company would have to pay property taxes at the normal commercial rate. The company could also lease cold storage space at Gulf Coast Cold Storage. The latter would have to expand its facilities at a cost of approximately $131,000, but had agreed to do so at its own expense if the plant were built. Pro forma data for the processing plant are shown in Exhibits 6 and 7. The data in Exhibit 6 are not inflated. The assumption is made in Exhibit 7 that the annual inflation rate will be 11%. The first sales for the processing plant were not expected to begin until 1981. The tax rate on income from the project was expected to be 48% (the combined US federal and Texas state tax rate). Any profits or losses from the project would be consolidated for tax purposes with the parent company's income statement. Also, in 1981, Harris Seafoods expected to receive a $650,000 tax credit for the investment in plant and equipment at the processing plant. The funds nexessary to finance the project were expected to come from two sources: (1) current liabilities which were generated in the normal course of business cg, accounts payable; and (2) investment of funds by the parent company. Current liabilities of the processing plant, comprised of accounts payable, taxes payable, and miscellaneous current liabilities, were expected to be 9% of total sales. This figure was low principally because processors had to pay cash for shrimp at most times during the year. Mr. Harris had been informed by the company's investment bankers that the company's effective interest cost on newly issued long-term debt would be 13.5%. The debt would be retired in equal installments over a 12-year period from the time of issue. The raw shrimp to be processed at the plant were to be purchased on the open market. There was a possibility that some Harris Seafoods product would be sold to the plant, but given the fact that demand exceeded supply for the shrimp company, few intercompany sales were contemplated The principal product to be produced was breaded shrimp. There were quite favorable projections for this part of the total shrimp market, particularly given the fact that breaded shrimp were significantly less expensive than frozen shrimp when measured on a per-pound basis. The cntire process was automated: machines sorted, pecled, devcined, breaded and packaged the shrimp in a continuous production line. Generally the breading materials (eggs, milk and ground crackers) were equal in weight to the raw shrimp. However, if the cost of raw Shrimp purchased on the open market by Harris Seafoods were $4.31 per pound, the cost to purchase the breading materials would only average 50.50 per pound of materials purchased. Marketing would be done by the existing Harris Seafoods sales organizacion. There were three kinds of customers: a Over the long run, Mr. Harris believed total debt (notes payable plus current maturities of long-term debt plus long-term debt) should not exceed 30% of total invested capital (total debt plus shareholders' equity) of the firm. There was a possibility that Harris Seafoods would be able to issue $7.0 million of 12-year maturity Industrial Revenue Bondst to fund the investment in property, plant, and equipment in the processing plant. These bonds would be amortized in equal installments over the 12-year life of the bond. The interest rate was expected to be 9.5%. Income on this kind of bond was not taxable to the buyer of the bond, but was tax deductible by the issuer. Though the bond would technically be issued by the municipality of Brownsville, Texas, the payment of interest and the repayment of principal would be made and guaranteed by Harris Seafoods. 1. Food service brokers-these called on institutional food service companies, national fast food chains and large schools and hospitals The Issues 2. Retail brokers-these sold to retail outlets such as grocery stores and supermarket chains Mr. Harris thought the project looked attractive, but was concemed that accepting it might reduce the company's high rate of return on invested capital. He also wondered how important the ability to issue the Industrial Revenue Bonds was to the value of the project. 3. Direct salesthe company felt it could bypass other distributors and sell directly to national restaurant food chains such as Arthur Treacher, Long John Silver and Morrison's Cafeteria. The combined usage of processed shrimp by these three organizations alone had been 8.5 million pounds in 1979, In the early years, it would be necessary to invest heavily in advertising and marketing. The brand image of the product was an essential contributor to success When operating at full capacity, the plant would be capable of producing 15 million pounds of product per year. At full capacity, the labor force required would total 400. The initial production and sales plan called for first-year manning of 300 workers, virtually all of whom would receive minimum wage Sales in the first year were projected to be 55 million pounds (37% of capacity). Within five years, it was expected that sales and the labor force would move toward the upper limits. 3 As of late February 1980, the prime rate was 15.5%. If Harris Seafoods borrowed from the banks, the effective cost of funds would be 16%. (See Exhibits for some data del recent trends in the economy and capital markets.) in order to encourage companies to invest in a local community, the municipality sometimes allowed firms to issue tax-exempt municipal bonds in an amount equal to the value of the investment in property, plant and equipment. The firms would pay interest at the rate appropriate for tax-exempt bonds rather than at the higher rate appropriate for bonds paying interest that represented taxable income to the buyer. The tax-exempt nature of the interest payments on Industrial Revenue Bands produced a significant loss of revenue for the US. 1975 1976 1977 1978 1979 Exhibit 2 Beginning Domestic u Ending Apparent Raw Shrimp Pounds Consumed $8282 $10.26 $4,045 $8,404 $8.95 $8.867 $5.975 $15.08 de 1.174 308 1.221 089851412140154 $5.00 SSES 518 2422 2.078 2.104.60 5 1,767 $1,650 $3.486 53.282 $2,978 57.810 18454 3 SRS NESPRESS ANN NA os 268) 89 1,905 3,282 2813 4,218 $4.00 sa v t 6,421 7.402 11.016121162 San 310.00 $13.002515.809 510.046 $20.08 $ 2,662 $2,007 5214 3 2013 $ 1,007 40 CATE $3.788 $4.31 1,345 1.433 1.807 2.626 $10.00 $13.00 1587 519545 SUVUN $27.204 Total still do Share Data un & OS TAS AB SON 8888894 Exhibit 3 * # m # # EE en and breathe 7: 1 5 12.149 514.277 $22.180 1.rn 24t# Fuaw1 Fss. 64 65 66 red chum calorias, god # # & # # Poin # in 9 # # # # 02 ent and Asset Requirements $3,297 2,874 $ (410) 2,178 4,561 so 0 S4.75 2.485 Exhibito Processing Plant Proposal Pro Forma Income Projections1980-19860% Inflation ($OOXIS) 2.935 EE 8 GS * $ - Fa * #*#*##* * FF * # # 11a * p 7 012 0 $ 6,171 $6.279 S7854 % * 301 B 1.427 $2.912 $6.171 $ 1.228 * Exhibits Selected Income Statement -one-dela Income Statement Cost of goods sold Sales Gross profit Notes payable Share Data 1980 1981 1982 1983 1984 1985 1986 281-054 -13- Sales Exhibit 8 Pounds (000s) Price per pound ($) 0 $ 4.75 5,500 $ 5.27 12,025 $ 5.85 14,265 $ 6.50 14,500 $ 7.21 14,750 $ 8.00 15,000 $ 8.88 Selected Statistics on the U.S. Economy and Capital Markets1970 to February 1980 Revenues $0 $ 28,999 $ 70,376 $ 92,669 $ 104,557 $ 118,059 $ 133,267 February 1980 1970 1971 1972 1973 1974 1975 1976 1977 1978 1979 0 $0 25.339 $ 3,660 57,708 75,989 $ 12,668 $ 16,680 85,737 $ 18,820 96,809 $ 21,251 109,279 $ 23,988 Cost of goods sold (excluding depreciation) Gross profit Selling, general and administrative Depreciation $982 4.9 4.9 5.4 5.5 2.2 $1,063 8.2 5.9 5.1 3.4 4.3 $1,171 10.2 5.6 4.1 3.4 4.7 $1,306 11.5 4.9 5.8 8.8 20.1 $1,412 8.1 5.6 9.7 12.2 12.2 $1,529 8.3 8.5 9.6 7.0 6.5 $1,702 11.3 7.7 5.2 4.8 0.6 $1,899 11.6 7.0 6.0 6.8 8.0 $2,128 12.1 6.0 7.3 9.0 11.8 $2,369 11.3 5.8 8.8 13.3 10.2 $2,521a 6.4a 6.0 9.5a 18.20 0.00 0 0 3,190 833 7,741 787 8,804 758 9,933 746 11,216 748 12,660 764 Pretax operating profit $0 $ (363) $ 4,139 $ 7,119 $ 8,141 $ 9,287 $ 10,564 1. Nominal gross national product 2. Percent change-gross national product 3. Unemployment rate 4. Percent change-GNP deflator 5. Percent change-consumer price index 6. Percent change-food price index 7. Prime interest rate 8. Interest rate-long-term AAA corporate bonds 9. Interest rate-long term BAA corporate bonds 10. Interest rate-long-term tax exempt, municipal bonds 11. Interest rate-U.S. Treasury bills (6 month) 12. Interest rate-long-term government bonds 8.03 Assets 7.44 Cash Accounts receivable Inventories Other current assets 450 0 2,485 0 290 2,416 5,063 580 704 5,862 9,810 1,408 927 7,719 12,918 1,853 1,046 8,710 14,575 2,091 1,181 9,834 16,457 2,361 1,333 11,101 18,577 2,665 7.91 8.04 9.11 6.51 6.56 7.35 5.72 7.39 8.56 5.70 4.51 6.16 5.25 7.21 8.16 5.27 4.47 6.21 8.24 5.18 7.18 6.84 10.81 8.57 9.50 6.09 7.93 7.56 7.86 8.83 10.61 6.89 6.12 7.99 6.84 8.43 9.75 6.49 5.27 7.61 6.83 8.02 8.97 5.56 5.51 7.42 9.06 8.73 9.49 5.90 7.57 8.41 12.67 9.63 10.69 6.39 10.02 9.44 15.50 12.64 13.57 8.04 12.79 12.41 Total current assets Net plant and equipment Other long-term assets $ 2,935 7,000 100 $ 8,348 6,944 435 $ 17,784 7,019 1,056 $ 23,417 7,218 1,390 $ 26,422 7,535 1,568 $ 29,834 7,966 1,771 $ 33,677 8,511 1,999 13. Return on equity-all U.S. manufacturing companies 14. New York stock exchange composite index 15. Percent change-New York stock exchange index 16. Percent yield-corporate stocks 9.3 45.72 (16.37) 3.83 9.7 54.22 18.59 3.14 10.6 60.29 11.20 12.8 57.42 (4.76) 3.06 14.9 43.84 (23.65) 11.6 45.73 4.31 4.31 13.9 54.46 19.09 3.72 14.2 53.69 (1.41) 4.62 15.0 53.71 0.04 5.28 16.3 58.32 8.58 5.45 NA 66.06 13.27 5.24a 2.84 4.47 Total assets $ 10,035 $ 15,727 $ 25,859 $ 32,025 $ 35,535 $ 39,570 $ 44,187 Sources: Economic Report of the President, 1979; Survey of Current Business. a Annualized rates. aDouble-declining balance method