Answered step by step
Verified Expert Solution
Question
1 Approved Answer
Video text description for the Direct Measurement Video of Relationships in a Copper Wire This video shows a simple circuit containing a coil of


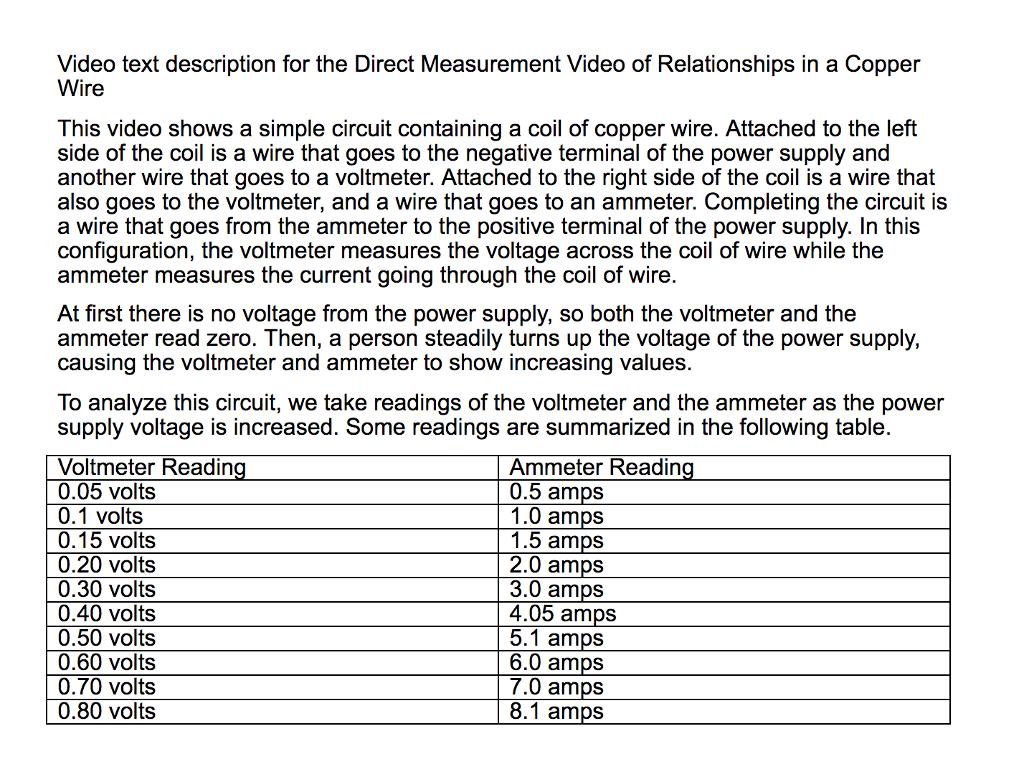
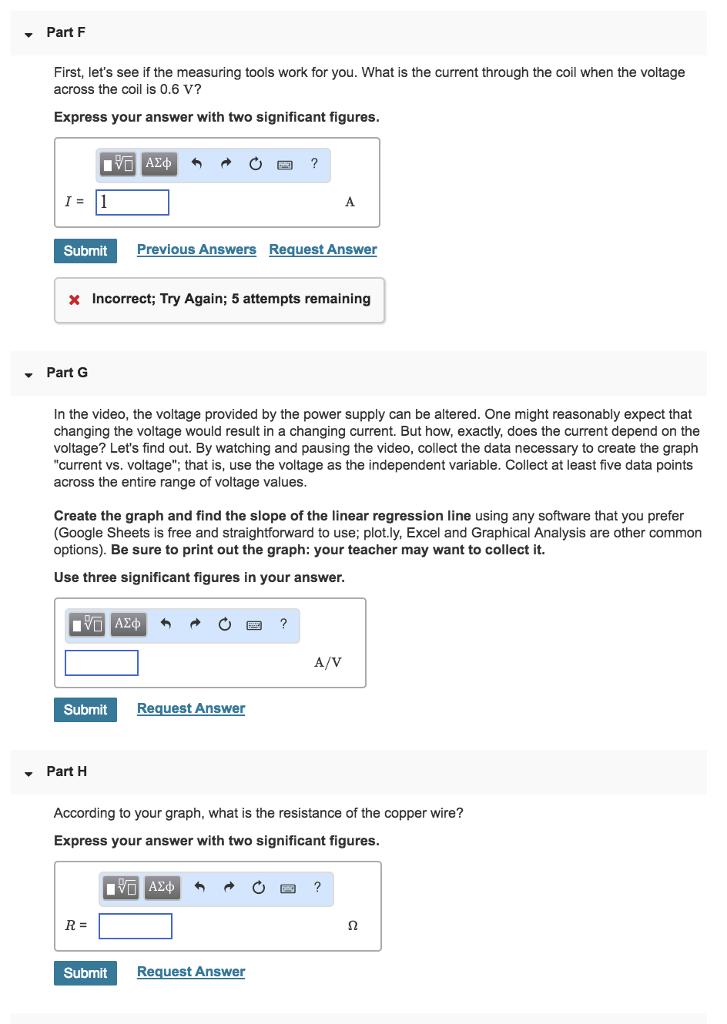
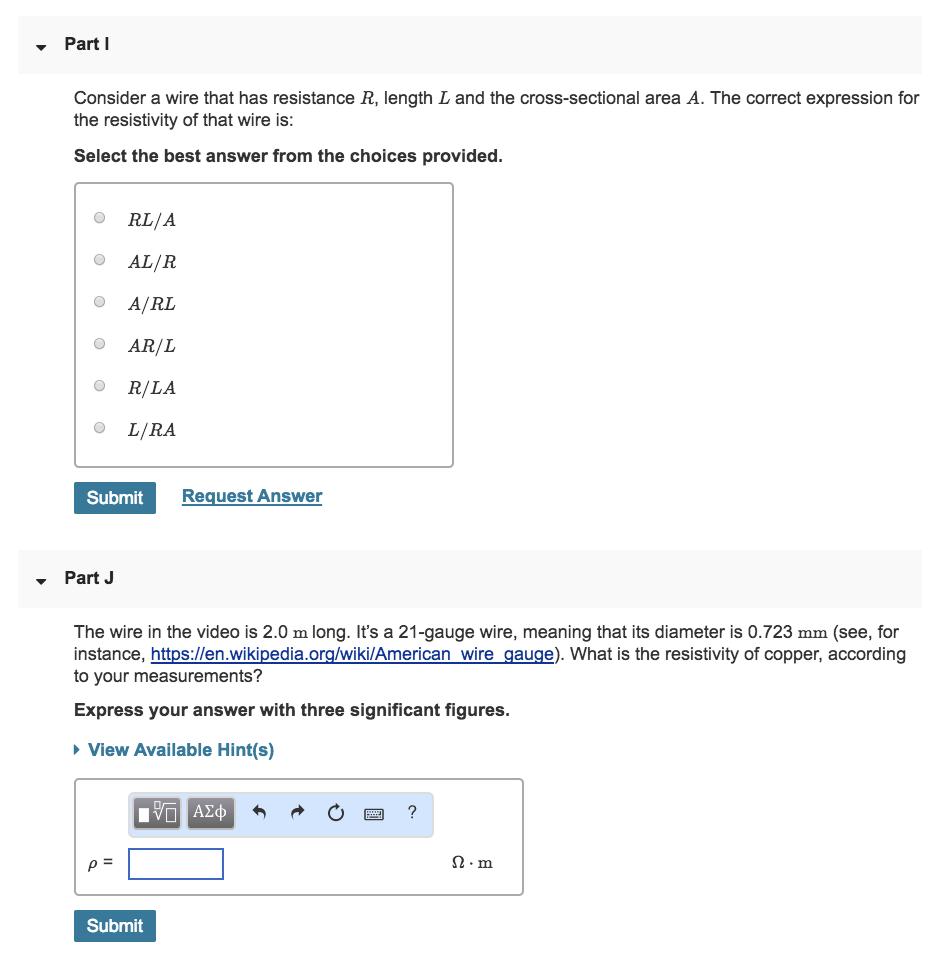
Video text description for the Direct Measurement Video of Relationships in a Copper Wire This video shows a simple circuit containing a coil of copper wire. Attached to the left side of the coil is a wire that goes to the negative terminal of the power supply and another wire that goes to a voltmeter. Attached to the right side of the coil is a wire that also goes to the voltmeter, and a wire that goes to an ammeter. Completing the circuit is a wire that goes from the ammeter to the positive terminal of the power supply. In this configuration, the voltmeter measures the voltage across the coil of wire while the ammeter measures the current going through the coil of wire. At first there is no voltage from the power supply, so both the voltmeter and the ammeter read zero. Then, a person steadily turns up the voltage of the power supply, causing the voltmeter and ammeter to show increasing values. To analyze this circuit, we take readings of the voltmeter and the ammeter as the power supply voltage is increased. Some readings are summarized in the following table. Ammeter Reading Voltmeter Reading 0.05 volts 0.1 volts 0.5 amps 1.0 amps 1.5 amps 0.15 volts 2.0 amps 0.20 volts 3.0 amps 0.30 volts 4.05 amps 0.40 volts 5.1 amps 0.50 volts 6.0 amps 0.60 volts 0.70 volts 7.0 amps 8.1 amps 0.80 volts Part F First, let's see if the measuring tools work for you. What is the current through the coil when the voltage across the coil is 0.6 V? Express your answer with two significant figures. IVE ? I = A Submit Previous Answers Request Answer x Incorrect; Try Again; 5 attempts remaining Part G In the video, the voltage provided by the power supply can be altered. One might reasonably expect that changing the voltage would result in a changing current. But how, exactly, does the current depend on the voltage? Let's find out. By watching and pausing the video, collect the data necessary to create the graph "current vs. voltage"; that is, use the voltage as the independent variable. Collect at least five data points across the entire range of voltage values. Create the graph and find the slope of the linear regression line using any software that you prefer (Google Sheets is free and straightforward to use; plot.ly, Excel and Graphical Analysis are other common options). Be sure to print out the graph: your teacher may want to collect it. Use three significant figures in your answer. LIVE 4 A ? A/V Submit Request Answer Part H According to your graph, what is the resistance of the copper wire? Express your answer with two significant figures. IVE ? R= Submit Request Answer Part I Consider a wire that has resistance R, length L and the cross-sectional area A. The correct expression for the resistivity of that wire is: Select the best answer from the choices provided. O RL/A O AL/R O A/RL O AR/L O R/LA O L/RA Submit Request Answer Part J The wire in the video is 2.0 m long. It's a 21-gauge wire, meaning that its diameter is 0.723 mm (see, for instance, https://en.wikipedia.org/wiki/American wire gauge). What is the resistivity of copper, according to your measurements? Express your answer with three significant figures. View Available Hint(s) LIVE ? p= n.m Submit
Step by Step Solution
★★★★★
3.52 Rating (155 Votes )
There are 3 Steps involved in it
Step: 1
yzm x c STATISTICS 09998 r09999 PARAMETERS m00991043 From Slope RESIDUA...
Get Instant Access to Expert-Tailored Solutions
See step-by-step solutions with expert insights and AI powered tools for academic success
Step: 2

Step: 3

Document Format ( 2 attachments)
635e3e300d898_183067.pdf
180 KBs PDF File
635e3e300d898_183067.docx
120 KBs Word File
Ace Your Homework with AI
Get the answers you need in no time with our AI-driven, step-by-step assistance
Get Started


