

Question
In this figure two possible demand curves are labelled D1 and D2; two possible supply curves are labelled S1 and S2 and four possible equilibrium
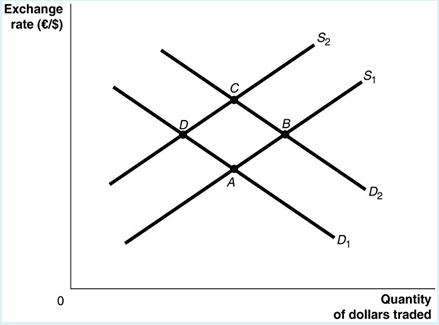
In this figure two possible demand curves are labelled D1 and D2; two possible supply curves are labelled S1 and S2 and four possible equilibrium points are labelled A, B, C and D.
These labels can be used to describe various scenarios in terms of shifts of demand and/or supply curves and the resulting equilibrium exchange rate.
Describe what will happen in the AUD-EURO market using the above graph and corresponding labels in the following scenarios. Carefully explain each step.
- Italy decreases the demand for Australian steel by 50%. Assume that the market is initially in equilibrium at point B
- Currency speculators believe that the value of the euro will decrease relative to the dollar. Assume that the market is initially in equilibrium at point A
- European investors increase their holdings of Australian Government's bonds. Assume that the market is initially in equilibrium at point A
- Interest rates in Australia increase relative to those in the European Union. Assume that the market is initially in equilibrium at point A
Step by Step Solution
There are 3 Steps involved in it
Step: 1

Get Instant Access to Expert-Tailored Solutions
See step-by-step solutions with expert insights and AI powered tools for academic success
Step: 2

Step: 3
Ace Your Homework with AI
Get the answers you need in no time with our AI-driven, step-by-step assistance
Get Started
Managerial Economics and Business Strategy
Authors: Michael R. baye
7th Edition
978-0073375960, 71267441, 73375969, 978-0071267441