Question
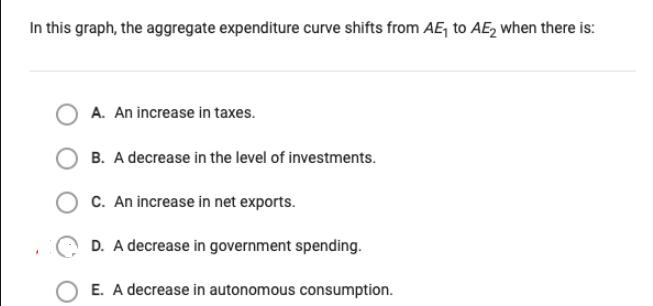
In this graph, the aggregate expenditure curve shifts from AE to AE2 when there is: * OA. An increase in taxes. B. A decrease


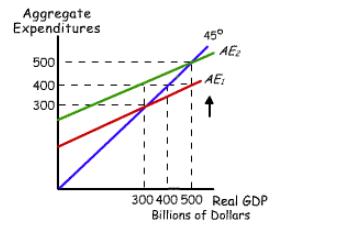
In this graph, the aggregate expenditure curve shifts from AE to AE2 when there is: * OA. An increase in taxes. B. A decrease in the level of investments. O C. An increase in net exports. D. A decrease in government spending. E. A decrease in autonomous consumption. Aggregate Expenditures 500 400 300 45 AE AE: 300 400 500 Real GDP Billions of Dollars
Step by Step Solution
3.55 Rating (152 Votes )
There are 3 Steps involved in it
Step: 1
The detailed answer for the above question is provided below In the context of the aggregate expendi...
Get Instant Access to Expert-Tailored Solutions
See step-by-step solutions with expert insights and AI powered tools for academic success
Step: 2

Step: 3

Ace Your Homework with AI
Get the answers you need in no time with our AI-driven, step-by-step assistance
Get StartedRecommended Textbook for
Principles Of Macroeconomics
Authors: Karl E. Case,Ray C. Fair , Sharon E. Oster
13th Global Edition
1292303824, 978-1292303826
Students also viewed these Economics questions
Question
Answered: 1 week ago
Question
Answered: 1 week ago
Question
Answered: 1 week ago
Question
Answered: 1 week ago
Question
Answered: 1 week ago
Question
Answered: 1 week ago
Question
Answered: 1 week ago
Question
Answered: 1 week ago
Question
Answered: 1 week ago
Question
Answered: 1 week ago
Question
Answered: 1 week ago
Question
Answered: 1 week ago
Question
Answered: 1 week ago
Question
Answered: 1 week ago
Question
Answered: 1 week ago
Question
Answered: 1 week ago
Question
Answered: 1 week ago
Question
Answered: 1 week ago
Question
Answered: 1 week ago
Question
Answered: 1 week ago
Question
Answered: 1 week ago
View Answer in SolutionInn App


