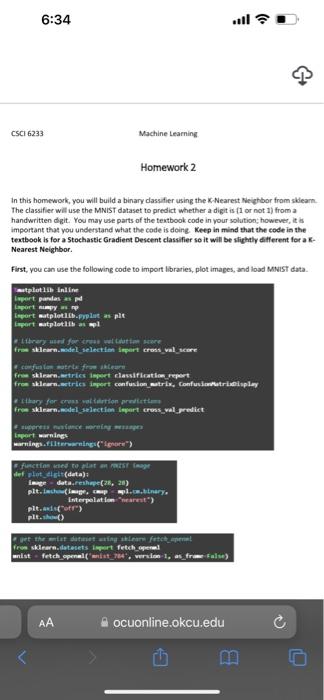
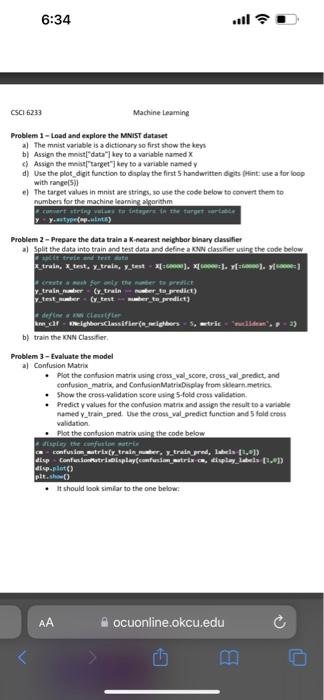
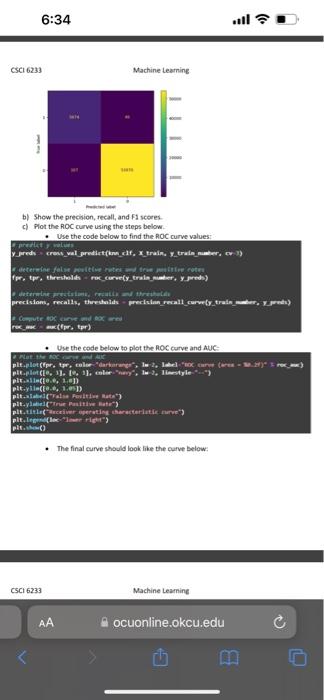
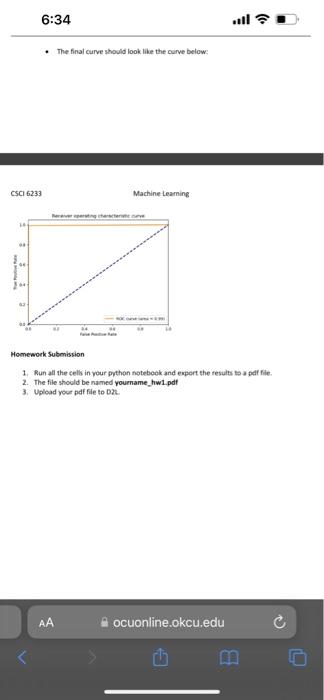
in this homework, you will build a binary dassifier using the X.Nearest Neighbor from skileam. The classifier will use the MNIST dataset to predict whether a digit is (1 or not 1) from a handwritten digit. You may use parts of the textbook code in your solution; however, it is important that you understand what the code is deing. Keep in mind that the code in the textbook is for a Stochastic Gradient Descent classifier so it will be slichally different for a KNearest Neighbor. First, you can use the following code to import libraries, plot images, and load MNISt data. Problem 1 - Load and explore the MNIst dataset a) The mnist variable is a dictionary so first show the keys b) Assign the mnibt["data"] hey to a variable named x c) Assiga the mhiof["Rarget"] key to a variable named y d) Use the plot_digit function to display the first 5 handwritten digits fHinti use a for loop with range[sy] e) The target values in mnist are strings, so wie the code below to cocvert them to mumbers for the machine learning algorithm Problem 2 - Prepare the data train a K-nearest neighbor binary dasifier a) Split the data into train and test data and define a KSN dassitier usine the code below b) train the KNN Classifier. Problern 3-Eyaluate the model a) Confusion Matrix - Plot the confusion matrix uning cross_val_score, cross_val predict, and confurion_matrix, and ConfesionMatrixDoplay from sklearn_metrica. - Show the cross-validation acore uring 5 -fold cross validation. - Predict y values for the confusion matrix and assign the cesult to a varibble named y_train_peed. Use the crost_val_predict function and 5 fold crows validation. - Plot the contusion matrix uning the code below - It should look similar to the one below. b) Show the precioion, recall, and F scores. c) Plot the ROC curve using the steps below. - Use the code below to find the ROC curve values: - The final curve should look like the curve below: cscl6233 Machine Learning Hemework Submission 1. Run all the cell in your python notebook and export the results to a par file. 2. The file should be named yourname hw1 pdf 3. Upload your pdf file to D2n
