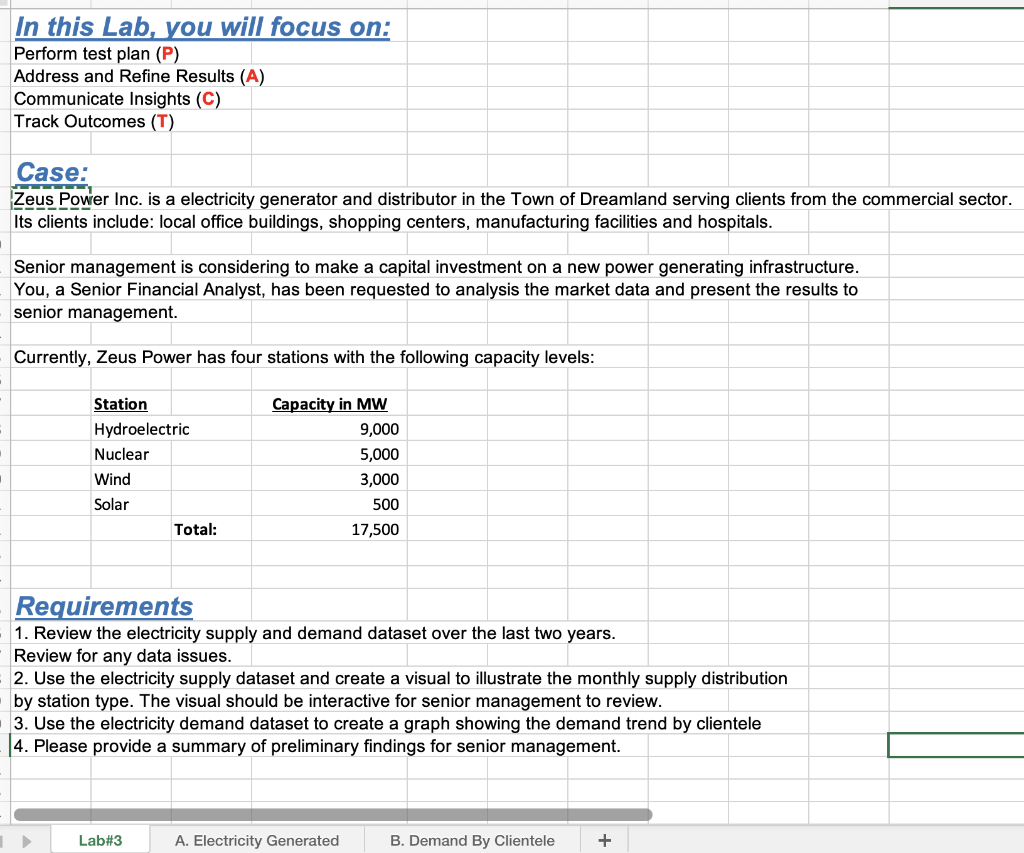
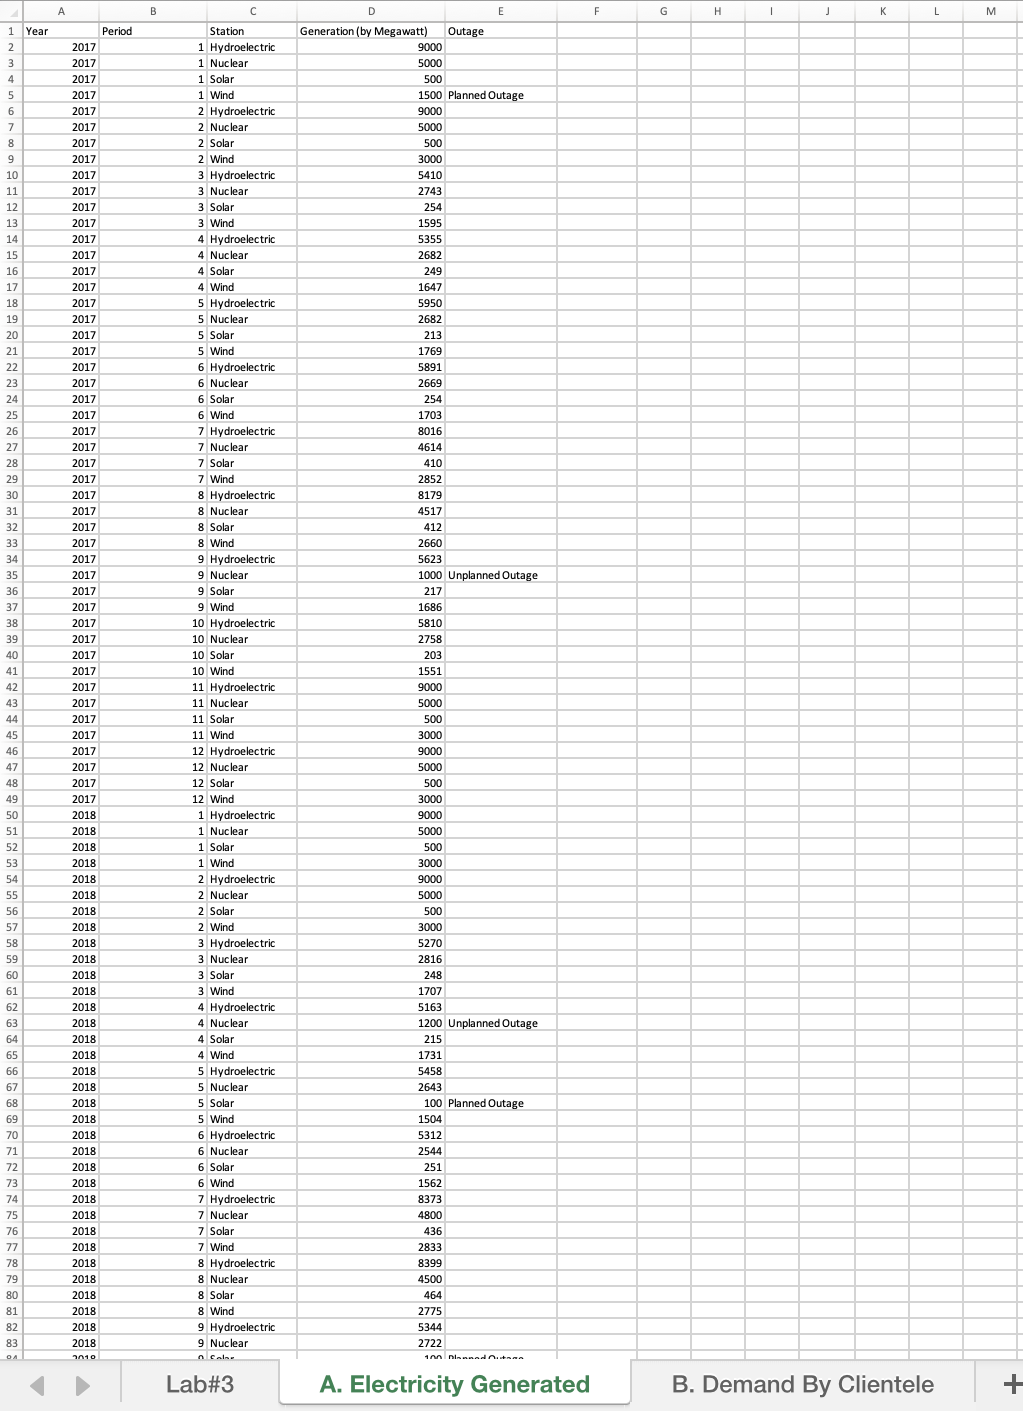
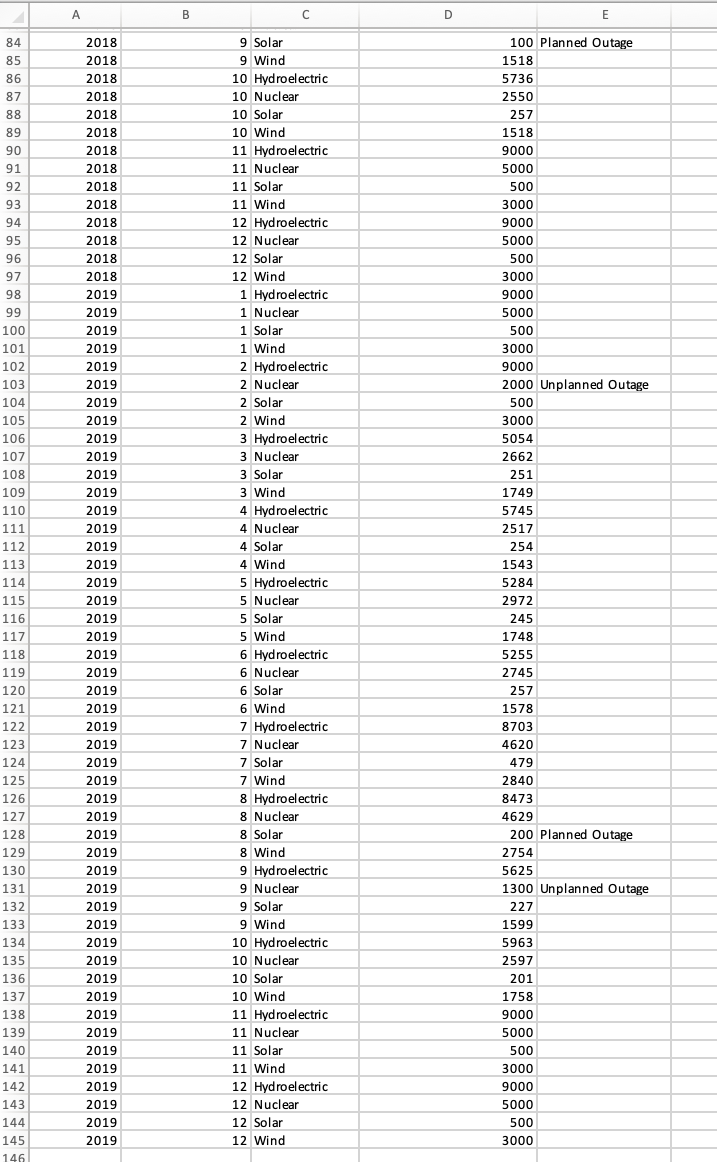
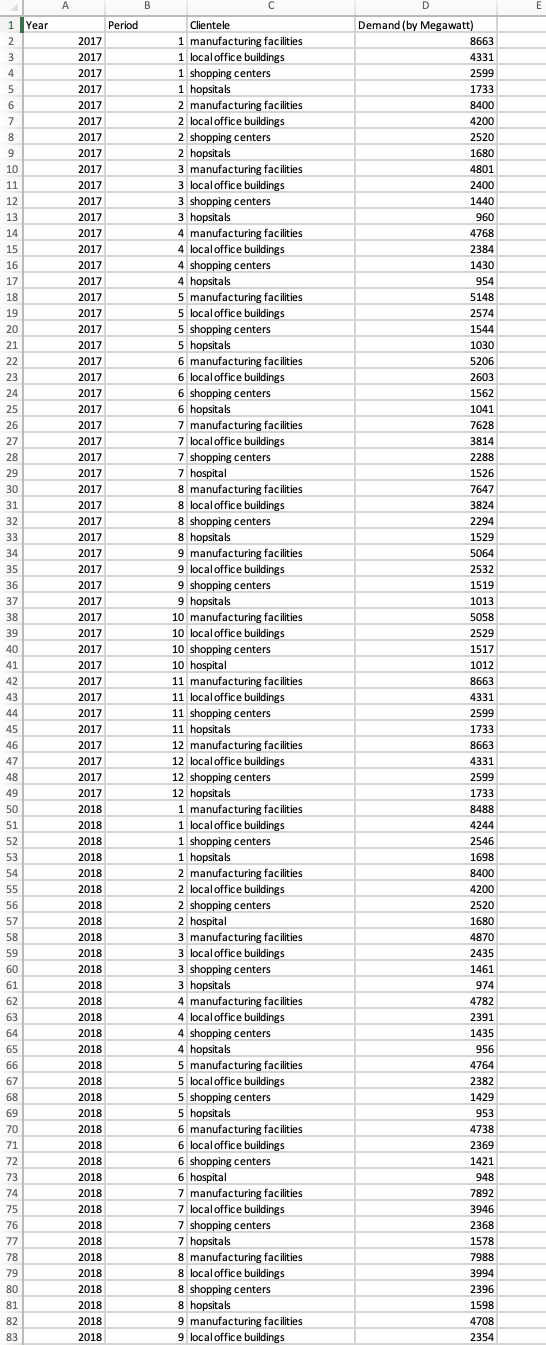
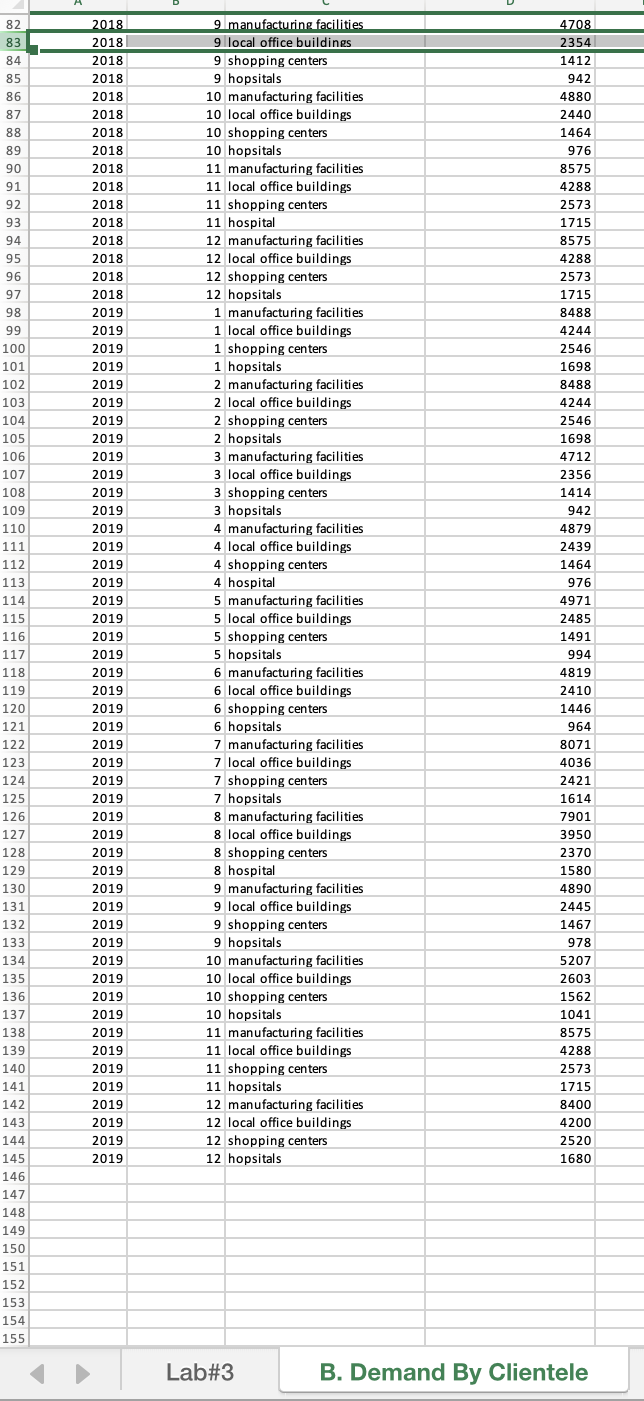
In this Lab, you will focus on: Perform test plan (P) Address and Refine Results (A) Communicate Insights (C) Track Outcomes (T) Case: Zeus Power Inc. is a electricity generator and distributor in the Town of Dreamland serving clients from the commercial sector. Its clients include: local office buildings, shopping centers, manufacturing facilities and hospitals. Senior management is considering to make a capital investment on a new power generating infrastructure. You, a Senior Financial Analyst, has been requested to analysis the market data and present the results to senior management. Currently, Zeus Power has four stations with the following capacity levels: Requirements 1. Review the electricity supply and demand dataset over the last two years. Review for any data issues. 2. Use the electricity supply dataset and create a visual to illustrate the monthly supply distribution by station type. The visual should be interactive for senior management to review. 3. Use the electricity demand dataset to create a graph showing the demand trend by clientele 4. Please provide a summary of preliminary findings for senior management. In this Lab, you will focus on: Perform test plan (P) Address and Refine Results (A) Communicate Insights (C) Track Outcomes (T) Case: Zeus Power Inc. is a electricity generator and distributor in the Town of Dreamland serving clients from the commercial sector. Its clients include: local office buildings, shopping centers, manufacturing facilities and hospitals. Senior management is considering to make a capital investment on a new power generating infrastructure. You, a Senior Financial Analyst, has been requested to analysis the market data and present the results to senior management. Currently, Zeus Power has four stations with the following capacity levels: Requirements 1. Review the electricity supply and demand dataset over the last two years. Review for any data issues. 2. Use the electricity supply dataset and create a visual to illustrate the monthly supply distribution by station type. The visual should be interactive for senior management to review. 3. Use the electricity demand dataset to create a graph showing the demand trend by clientele 4. Please provide a summary of preliminary findings for senior management


