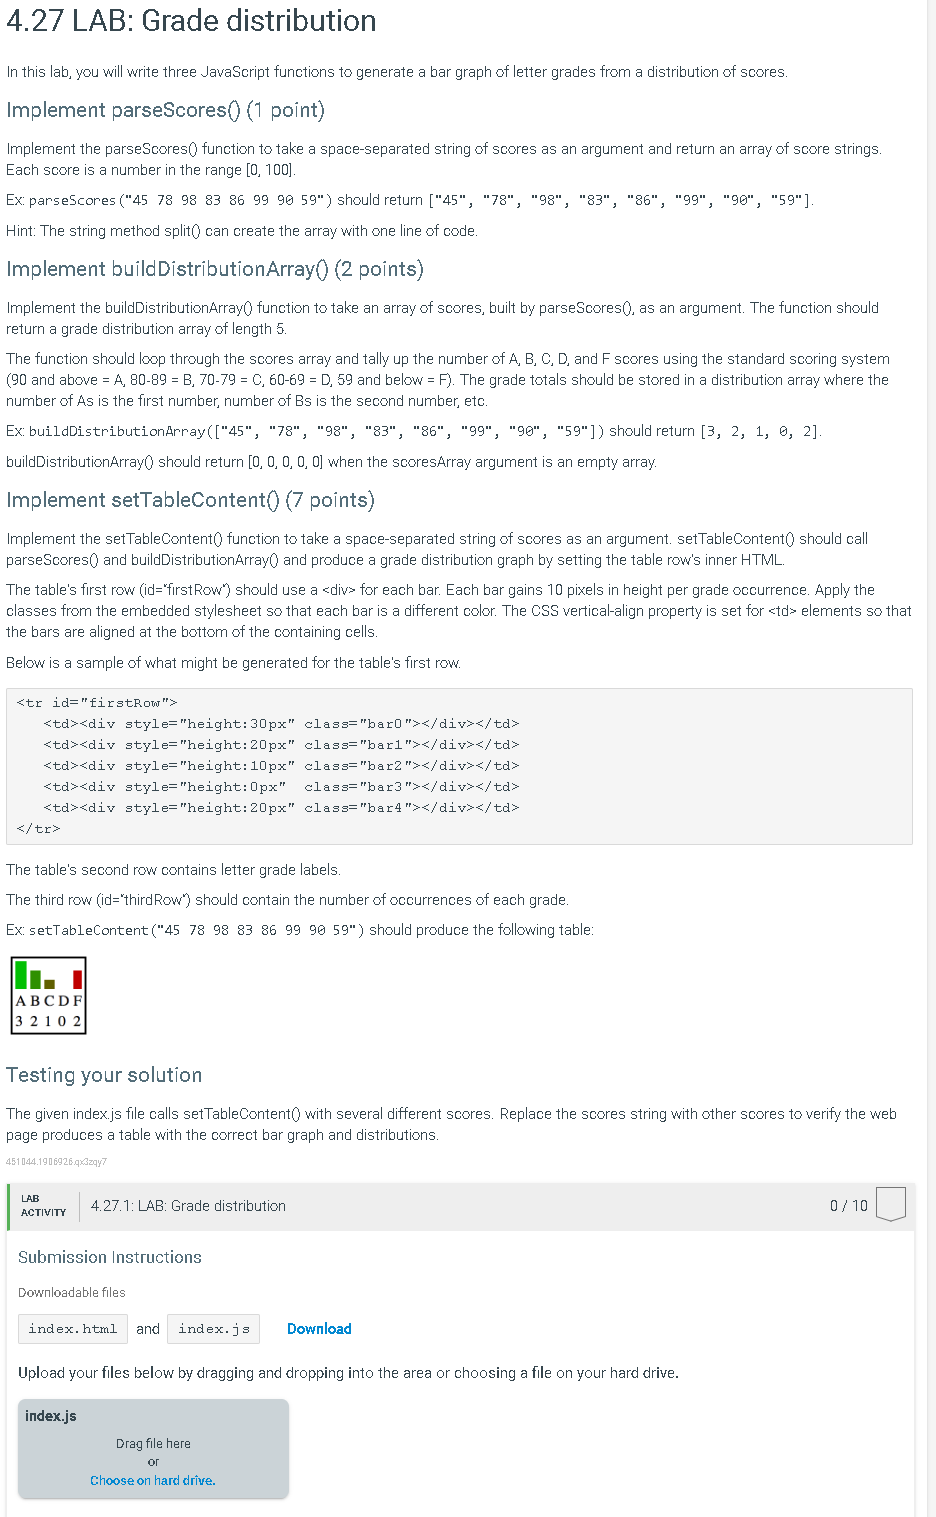
In this lab, you will write three JavaScript functions to generate a bar graph of letter grades from a distribution of scores. Implement parseScores 0 ( 1 point) Implement the parseScores 0 function to take a space-separated string of scores as an argument and return an array of score strings. Each score is a number in the range [0,100]. Ex: parsescores ("45 789883869990 59") should return ["45", "78", "98", "83", "86", "99", "90", "59"]. Hint: The string method split 0 can create the array with one line of code. Implement buildDistributionArray 0 ( 2 points) Implement the buildDistributionArray0 function to take an array of scores, built by parseScores0, as an argument. The function should return a grade distribution array of length 5. The function should loop through the scores array and tally up the number of A, B, C, D, and F scores using the standard scoring system ( 90 and above =A,8089=B,7079=C,6069=D,59 and below =F ). The grade totals should be stored in a distribution array where the number of As is the first number, number of Bs is the second number, etc. Ex: buildDistributionArray (["45", "78", "98", "83", "86", "99", "90", "59"]) should return [3, 2, 1, 0 , 2] . buildDistributionArray0 should return [0,0,0,0,0] when the scoresArray argument is an empty array. Implement setTableContent 0 ( 7 points) Implement the setTablecontent 0 function to take a space-separated string of scores as an argument. setTableContent 0 should call parseScores 0 and buildDistributionArrayO and produce a grade distribution graph by setting the table row's inner HTML. The table's first row (id="firstRow") should use a for each bar. Each bar gains 10 pixels in height per grade occurrence. Apply the classes from the embedded stylesheet so that each bar is a different color. The CSS vertical-align property is set for ctd elements so that the bars are aligned at the bottom of the containing cells. Below is a sample of what might be generated for the table's first row. The table's second row contains letter grade labels. The third row (id="thirdRow") should contain the number of occurrences of each grade. Ex: setTableContent("45 78988386999059 ") should produce the following table: Testing your solution The given index.js file calls setTablecontent 0 with several different scores. Replace the scores string with other scores to verify the web page produces a table with the correct bar graph and distributions. 451044.1906926.93z29y7 4.27.1: LAB: Grade distribution 0/10 Submission Instructions Downloadable files and Upload your files below by dragging and dropping into the area or choosing a file on your hard drive