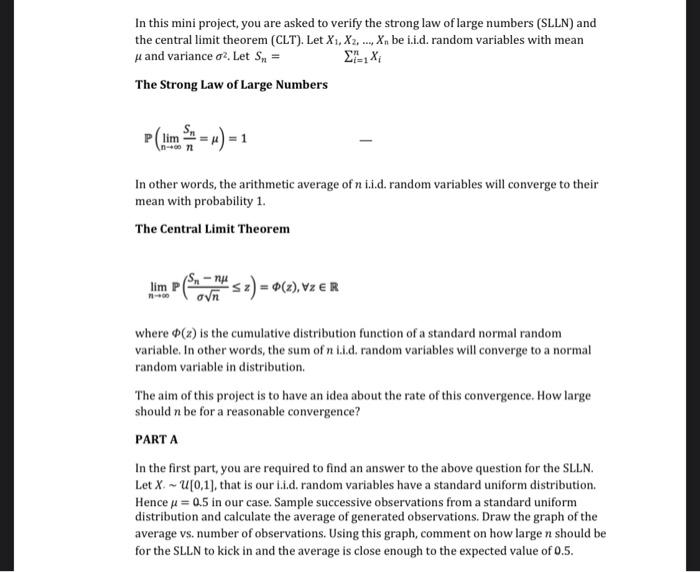
In this mini project, you are asked to verify the strong law of large numbers (SLLN) and the central limit theorem (CLT). Let X1, X2, ..., Xn be i.i.d. random variables with mean 4 and variance oz. Let Sn = The Strong Law of Large Numbers lim n-007 u) = 1 In other words, the arithmetic average of ni.i.d. random variables will converge to their mean with probability 1. The Central Limit Theorem lim planom - 2) = o(2), vzeR Sn- sz where (2) is the cumulative distribution function of a standard normal random variable. In other words, the sum of n iid, random variables will converge to a normal random variable in distribution. The aim of this project is to have an idea about the rate of this convergence. How large should n be for a reasonable convergence? PART A In the first part you are required to find an answer to the above question for the SLLN. Let X. - U[0,1), that is our 1.1.d. random variables have a standard uniform distribution. Hence u = 0.5 in our case. Sample successive observations from a standard uniform distribution and calculate the average of generated observations. Draw the graph of the average vs. number of observations. Using this graph, comment on how large n should be for the SLLN to kick in and the average is close enough to the expected value of 0.5. In this mini project, you are asked to verify the strong law of large numbers (SLLN) and the central limit theorem (CLT). Let X1, X2, ..., Xn be i.i.d. random variables with mean 4 and variance oz. Let Sn = The Strong Law of Large Numbers lim n-007 u) = 1 In other words, the arithmetic average of ni.i.d. random variables will converge to their mean with probability 1. The Central Limit Theorem lim planom - 2) = o(2), vzeR Sn- sz where (2) is the cumulative distribution function of a standard normal random variable. In other words, the sum of n iid, random variables will converge to a normal random variable in distribution. The aim of this project is to have an idea about the rate of this convergence. How large should n be for a reasonable convergence? PART A In the first part you are required to find an answer to the above question for the SLLN. Let X. - U[0,1), that is our 1.1.d. random variables have a standard uniform distribution. Hence u = 0.5 in our case. Sample successive observations from a standard uniform distribution and calculate the average of generated observations. Draw the graph of the average vs. number of observations. Using this graph, comment on how large n should be for the SLLN to kick in and the average is close enough to the expected value of 0.5


