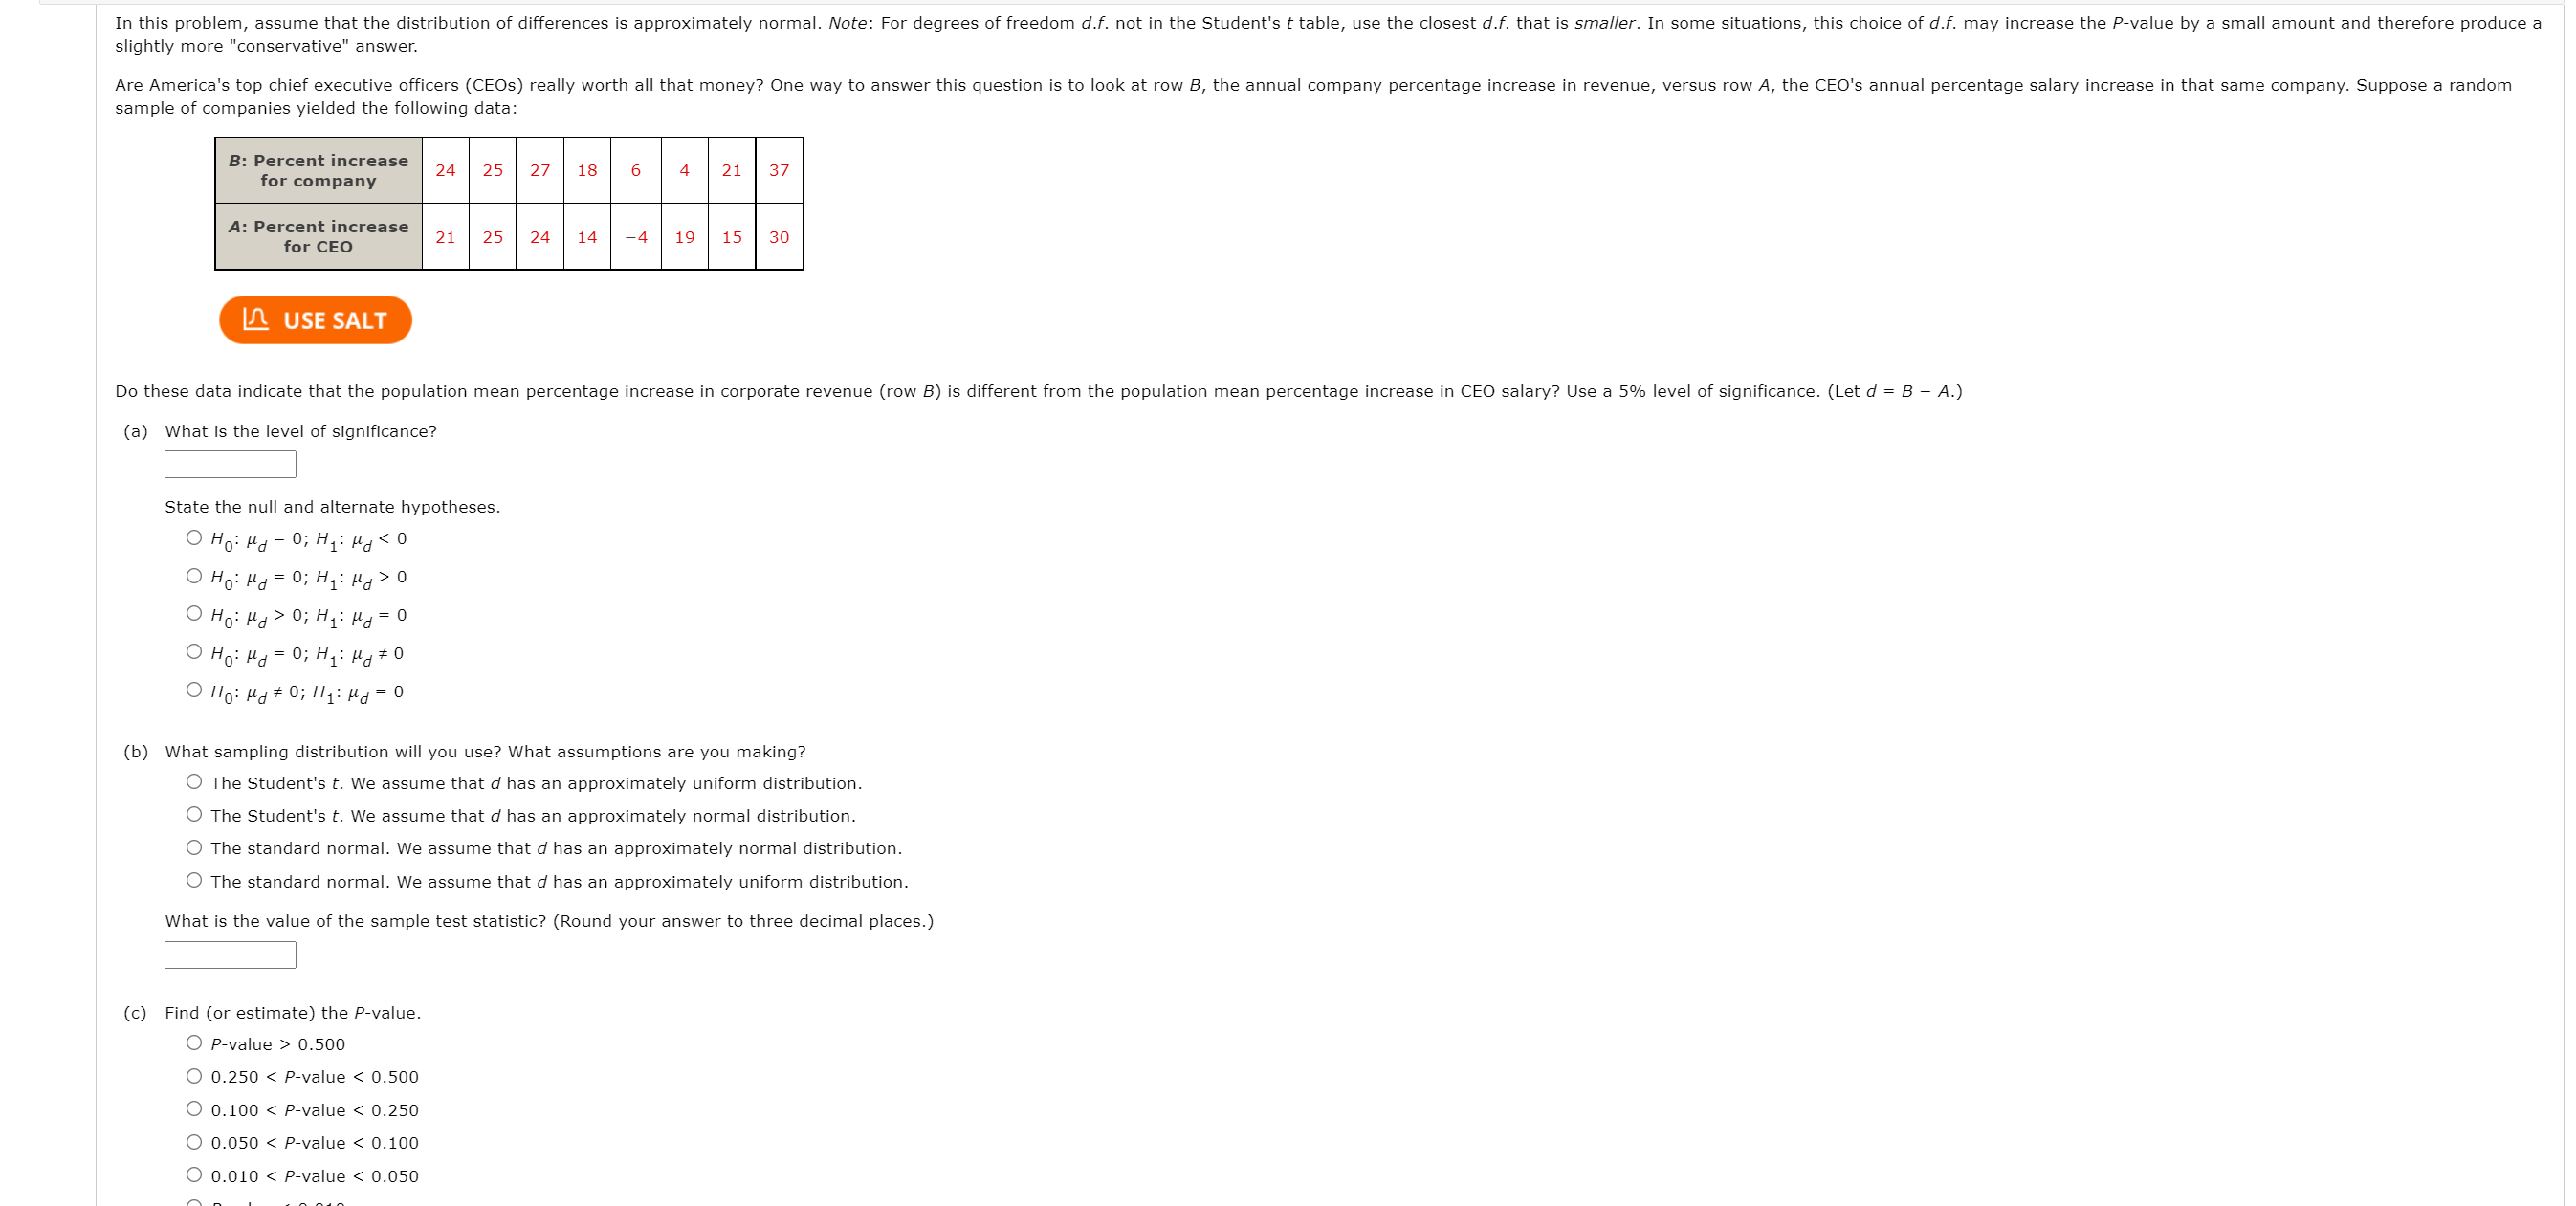
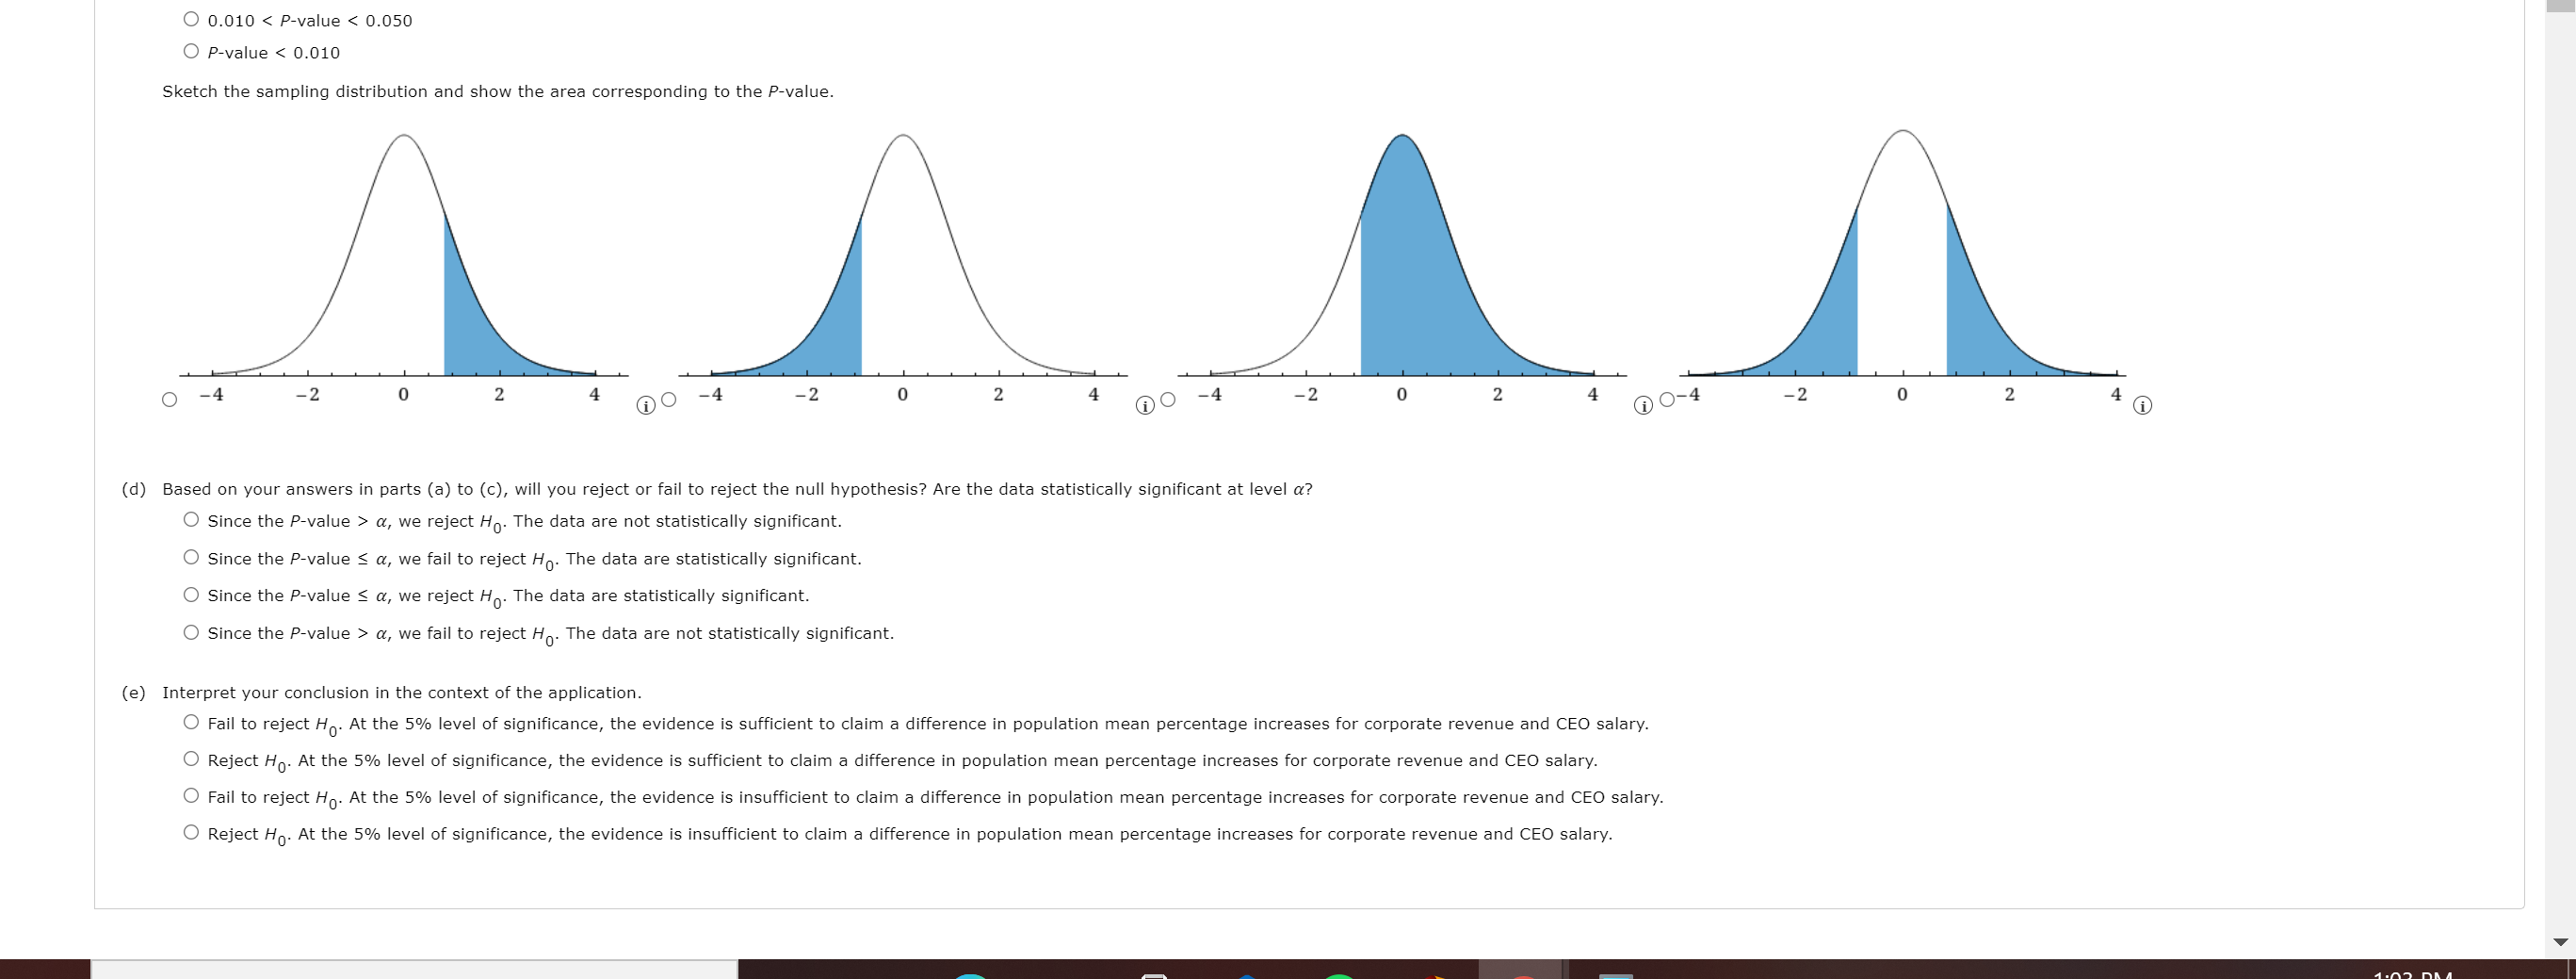
in this pnoblem, assume that the distribution of differences is approximately normal. Note: For degrees of freedom df. not in the student's t table, use the closest d.f. that is smaller. in some situations, this choice of i1.f. may increase the Pwalue by a small amount and therefore produce a slightly more "conservative" answer. Are America's top chief executive officers (CEOs) really worth all that money? One way to answer this question is to look at row 5, the annual company percentage increase in revenue, versus row A, the ch's annual percentage salary increase in that same company. Suppose a random sample of companies ylelded the following data: Percent inure-la for company 24 25 27 186 42137 A: Pamnl inmue for ch l USE SALT Do these data indicate that the population mean percentage increase in corporate revenue (row 8) is different from the population mean percentage increase in CEO salary? use a 5% level of signicance. (Let d = E A.) 21 25 2A 14 74 19 15 3D (a) What is the level of significance? state the null and alternate hypotheses. O Ho: ltd= 0;H': u40 0 H0: ud> 0; H1: ud= 0 O Ho: 1'4: 0;H1: udto OHD:pda0;H,:pd:0 (b) what sampling distribution will you use? What assumptions are you maklng? O The student's t. We assume that d has an approximately uniform distribution. 0 The student's t. We assume that d has an approximately normal distribution. 0 The standard normal. We assume that t! has an approximately normal dlstrlbutlnn. O The standard normal. We assume that .1 has an approximately uniform distribution. what Is the value of the sample test statistic? (Round your answer to three decimal places.) I: (c) Find (or estimate) the Pvalue. O Psvalue > 0.500 O 0.250 a, we reject Ho. The data are not statistically significant. O Since the P-value S a, we fail to reject Ho. The data are statistically significant. O Since the P-value S a, we reject Ho. The data are statistically significant. O Since the P-value > a, we fail to reject Ho. The data are not statistically significant. (e) Interpret your conclusion in the context of the application. O Fail to reject Ho. At the 5% level of significance, the evidence is sufficient to claim a difference in population mean percentage increases for corporate revenue and CEO salary. O Reject Ho. At the 5% level of significance, the evidence is sufficient to claim a difference in population mean percentage increases for corporate revenue and CEO salary. O Fail to reject Ho. At the 5% level of significance, the evidence is insufficient to claim a difference in population mean percentage increases for corporate revenue and CEO salary. O Reject Ho. At the 5% level of significance, the evidence is insufficient to claim a difference in population mean percentage increases for corporate revenue and CEO salary