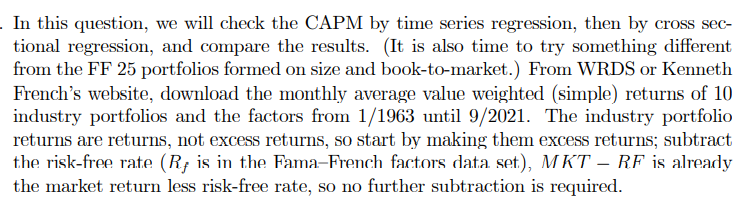
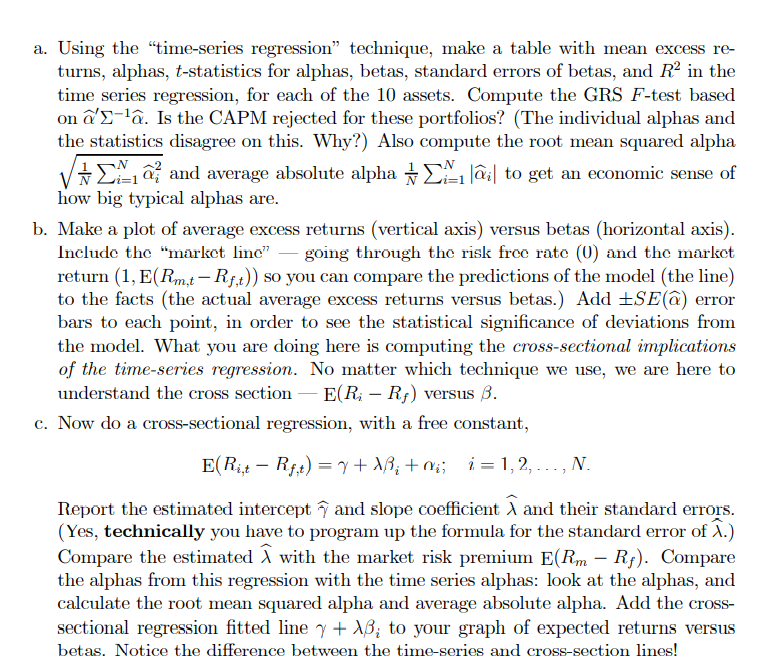
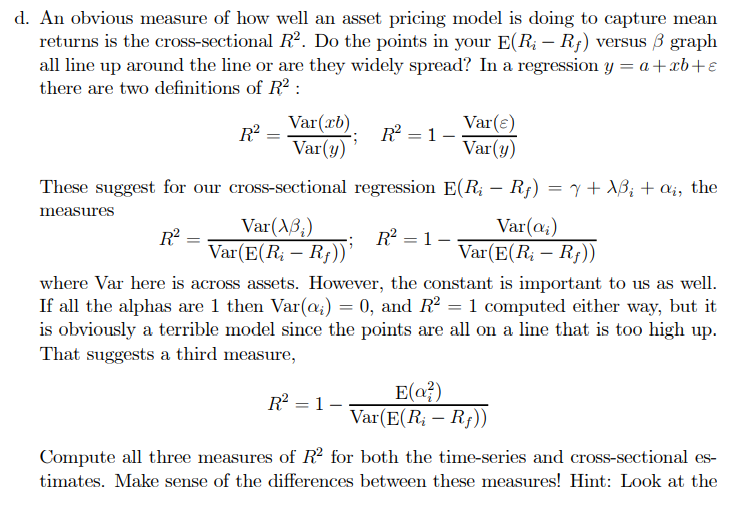
In this question, we will check the CAPM by time series regression, then by cross sec- tional regression, and compare the results. (It is also time to try something different from the FF 25 portfolios formed on size and book-to-market.) From WRDS or Kenneth French's website, download the monthly average value weighted (simple) returns of 10 industry portfolios and the factors from 1/1963 until 9/2021. The industry portfolio returns are returns, not excess returns, so start by making them excess returns; subtract the risk-free rate (R; is in the Fama-French factors data set), MKT RF is already the market return less risk-free rate, so no further subtraction is required. a. Using the time-series regression technique, make a table with mean excess re- turns, alphas, t-statistics for alphas, betas, standard errors of betas, and R2 in the time series regression, for each of the 10 assets. Compute the GRS F-test based on 'E-'. Is the CAPM rejected for these portfolios? (The individual alphas and the statistics disagree on this. Why?) Also compute the root mean squared alpha V #22 z and average absolute alpha +41 li to get an economic sense of how big typical alphas are. b. Make a plot of average excess returns (vertical axis) versus betas (horizontal axis). Include the "market line going through the risk froc rato (0) and the market return (1, E(Rm,t-Rf,t)) so you can compare the predictions of the model (the line) to the facts (the actual average excess returns versus betas.) Add ESE@) error bars to each point, in order to see the statistical significance of deviations from the model. What you are doing here is computing the cross-sectional implications of the time-series regression. No matter which technique we use, we are here to understand the cross section - E(Ri Ri) versus B. c. Now do a cross-sectional regression, with a free constant, E(Ri,t - Rf,t) = 7+18; +ai; i = 1, 2, ...,N. Report the estimated intercept and slope coefficient and their standard errors. (Yes, technically you have to program up the formula for the standard error of .) Compare the estimated with the market risk premium E(Rm Rf). Compare the alphas from this regression with the time series alphas: look at the alphas, and calculate the root mean squared alpha and average absolute alpha. Add the cross- sectional regression fitted line 7 + AB; to your graph of expected returns versus betas. Notice the difference between the time-series and cross-section lines! d. An obvious measure of how well an asset pricing model is doing to capture mean returns is the cross-sectional R. Do the points in your E(R; Rf) versus B graph all line up around the line or are they widely spread? In a regression y = a + xb+E there are two definitions of R2 : R2 Var(cb) R = 1 - Var(8) Var(y) Var(y) These suggest for our cross-sectional regression E(R; Rp) = 7+ 18; + di, the measures Var(18) Var(Q;) R2 R? = 1 - Var(E(Ri Rp))' Var(E(Ri - Rp)) where Var here is across assets. However, the constant is important to us as well. If all the alphas are 1 then Var(ai) = 0, and R2 = 1 computed either way, but it is obviously a terrible model since the points are all on a line that is too high up. That suggests a third measure, R = 1- E(0) Var(E(R; - Rf)) - == Compute all three measures of R2 for both the time-series and cross-sectional es- timates. Make sense of the differences between these measures! Hint: Look at the graph of course. In an OLS regression we have Var(y) = Var(xb) + Var(s) since by construction the errors are uncorrelated with the right hand variables. Also in an OLS regression we have E(i) = 0 by construction any mean gets soaked up into the constant. These observations mean that the measures are the same if the line is fit by an OLS regression. Computer hint: this will work better if you use Var(2) = (zi 7)? to compute variance, not Var(x) = N-1 (zi 7)? e. Finally, run the Fama-MacBeth cross sectional regression. Here is the idea. The above cross sectional regression takes average of returns, and then runs once average returns on betas across assets, with an ugly formula for standard deviation. Fama MacBeth instead runs a new cross-sectional regression every time period, Ri,t - RJ,t = 7 + AB; + Qi, t; i = 1, 2, ...,N for each t Then, you average the , and a to get your overall estimates, = E(4) and ; = E(@i,t) Rather than an ugly formula, Fama-MacBeth suggest you use our old friend o/VT to figure out the standard errors of land covariance of a, och) = 0(1) Cov(@t, af) and Cov(@,a') = T VT Thus, compute the land from the Fama MacBeth approach and compare them with the land you got from the cross-sectional regression. Compute the o) from Fama-MacBeth approach and compare that to the value from the cross- sectional regression. Compute the x test statistic ' Cova, a')-l and compare that with the value from the cross-sectional regression. Remark: You should see that the CAPM works ok, if not great, in this data set. The cross sectional regression wants to fit average returns versus beta with a substantially flatter line than the time series regression. This is a typical result from the pre-Fama- French days. If you ever run a cross sectional regression in real life, you can (and should) cure" this behavior by including the factors, i.e., R; (always zero) and (Rm Rf) as test assets. I want you to see how the CAPM works as a reasonable approximation in many cases, i.e., for portfolios not sorted by book/market ratio. Of course, now we would look at these industries and notice that they vary a great deal in size and book/market, and suppose that average returns and betas really attach to those characteristics. Running the FF3F model is a fun thing to do here, but there is a limit (yes, there is a limit). (If you are curious, see Fama and French (1997) Industry costs of equity.) And, of course, In this question, we will check the CAPM by time series regression, then by cross sec- tional regression, and compare the results. (It is also time to try something different from the FF 25 portfolios formed on size and book-to-market.) From WRDS or Kenneth French's website, download the monthly average value weighted (simple) returns of 10 industry portfolios and the factors from 1/1963 until 9/2021. The industry portfolio returns are returns, not excess returns, so start by making them excess returns; subtract the risk-free rate (R; is in the Fama-French factors data set), MKT RF is already the market return less risk-free rate, so no further subtraction is required. a. Using the time-series regression technique, make a table with mean excess re- turns, alphas, t-statistics for alphas, betas, standard errors of betas, and R2 in the time series regression, for each of the 10 assets. Compute the GRS F-test based on 'E-'. Is the CAPM rejected for these portfolios? (The individual alphas and the statistics disagree on this. Why?) Also compute the root mean squared alpha V #22 z and average absolute alpha +41 li to get an economic sense of how big typical alphas are. b. Make a plot of average excess returns (vertical axis) versus betas (horizontal axis). Include the "market line going through the risk froc rato (0) and the market return (1, E(Rm,t-Rf,t)) so you can compare the predictions of the model (the line) to the facts (the actual average excess returns versus betas.) Add ESE@) error bars to each point, in order to see the statistical significance of deviations from the model. What you are doing here is computing the cross-sectional implications of the time-series regression. No matter which technique we use, we are here to understand the cross section - E(Ri Ri) versus B. c. Now do a cross-sectional regression, with a free constant, E(Ri,t - Rf,t) = 7+18; +ai; i = 1, 2, ...,N. Report the estimated intercept and slope coefficient and their standard errors. (Yes, technically you have to program up the formula for the standard error of .) Compare the estimated with the market risk premium E(Rm Rf). Compare the alphas from this regression with the time series alphas: look at the alphas, and calculate the root mean squared alpha and average absolute alpha. Add the cross- sectional regression fitted line 7 + AB; to your graph of expected returns versus betas. Notice the difference between the time-series and cross-section lines! d. An obvious measure of how well an asset pricing model is doing to capture mean returns is the cross-sectional R. Do the points in your E(R; Rf) versus B graph all line up around the line or are they widely spread? In a regression y = a + xb+E there are two definitions of R2 : R2 Var(cb) R = 1 - Var(8) Var(y) Var(y) These suggest for our cross-sectional regression E(R; Rp) = 7+ 18; + di, the measures Var(18) Var(Q;) R2 R? = 1 - Var(E(Ri Rp))' Var(E(Ri - Rp)) where Var here is across assets. However, the constant is important to us as well. If all the alphas are 1 then Var(ai) = 0, and R2 = 1 computed either way, but it is obviously a terrible model since the points are all on a line that is too high up. That suggests a third measure, R = 1- E(0) Var(E(R; - Rf)) - == Compute all three measures of R2 for both the time-series and cross-sectional es- timates. Make sense of the differences between these measures! Hint: Look at the graph of course. In an OLS regression we have Var(y) = Var(xb) + Var(s) since by construction the errors are uncorrelated with the right hand variables. Also in an OLS regression we have E(i) = 0 by construction any mean gets soaked up into the constant. These observations mean that the measures are the same if the line is fit by an OLS regression. Computer hint: this will work better if you use Var(2) = (zi 7)? to compute variance, not Var(x) = N-1 (zi 7)? e. Finally, run the Fama-MacBeth cross sectional regression. Here is the idea. The above cross sectional regression takes average of returns, and then runs once average returns on betas across assets, with an ugly formula for standard deviation. Fama MacBeth instead runs a new cross-sectional regression every time period, Ri,t - RJ,t = 7 + AB; + Qi, t; i = 1, 2, ...,N for each t Then, you average the , and a to get your overall estimates, = E(4) and ; = E(@i,t) Rather than an ugly formula, Fama-MacBeth suggest you use our old friend o/VT to figure out the standard errors of land covariance of a, och) = 0(1) Cov(@t, af) and Cov(@,a') = T VT Thus, compute the land from the Fama MacBeth approach and compare them with the land you got from the cross-sectional regression. Compute the o) from Fama-MacBeth approach and compare that to the value from the cross- sectional regression. Compute the x test statistic ' Cova, a')-l and compare that with the value from the cross-sectional regression. Remark: You should see that the CAPM works ok, if not great, in this data set. The cross sectional regression wants to fit average returns versus beta with a substantially flatter line than the time series regression. This is a typical result from the pre-Fama- French days. If you ever run a cross sectional regression in real life, you can (and should) cure" this behavior by including the factors, i.e., R; (always zero) and (Rm Rf) as test assets. I want you to see how the CAPM works as a reasonable approximation in many cases, i.e., for portfolios not sorted by book/market ratio. Of course, now we would look at these industries and notice that they vary a great deal in size and book/market, and suppose that average returns and betas really attach to those characteristics. Running the FF3F model is a fun thing to do here, but there is a limit (yes, there is a limit). (If you are curious, see Fama and French (1997) Industry costs of equity.) And, of course