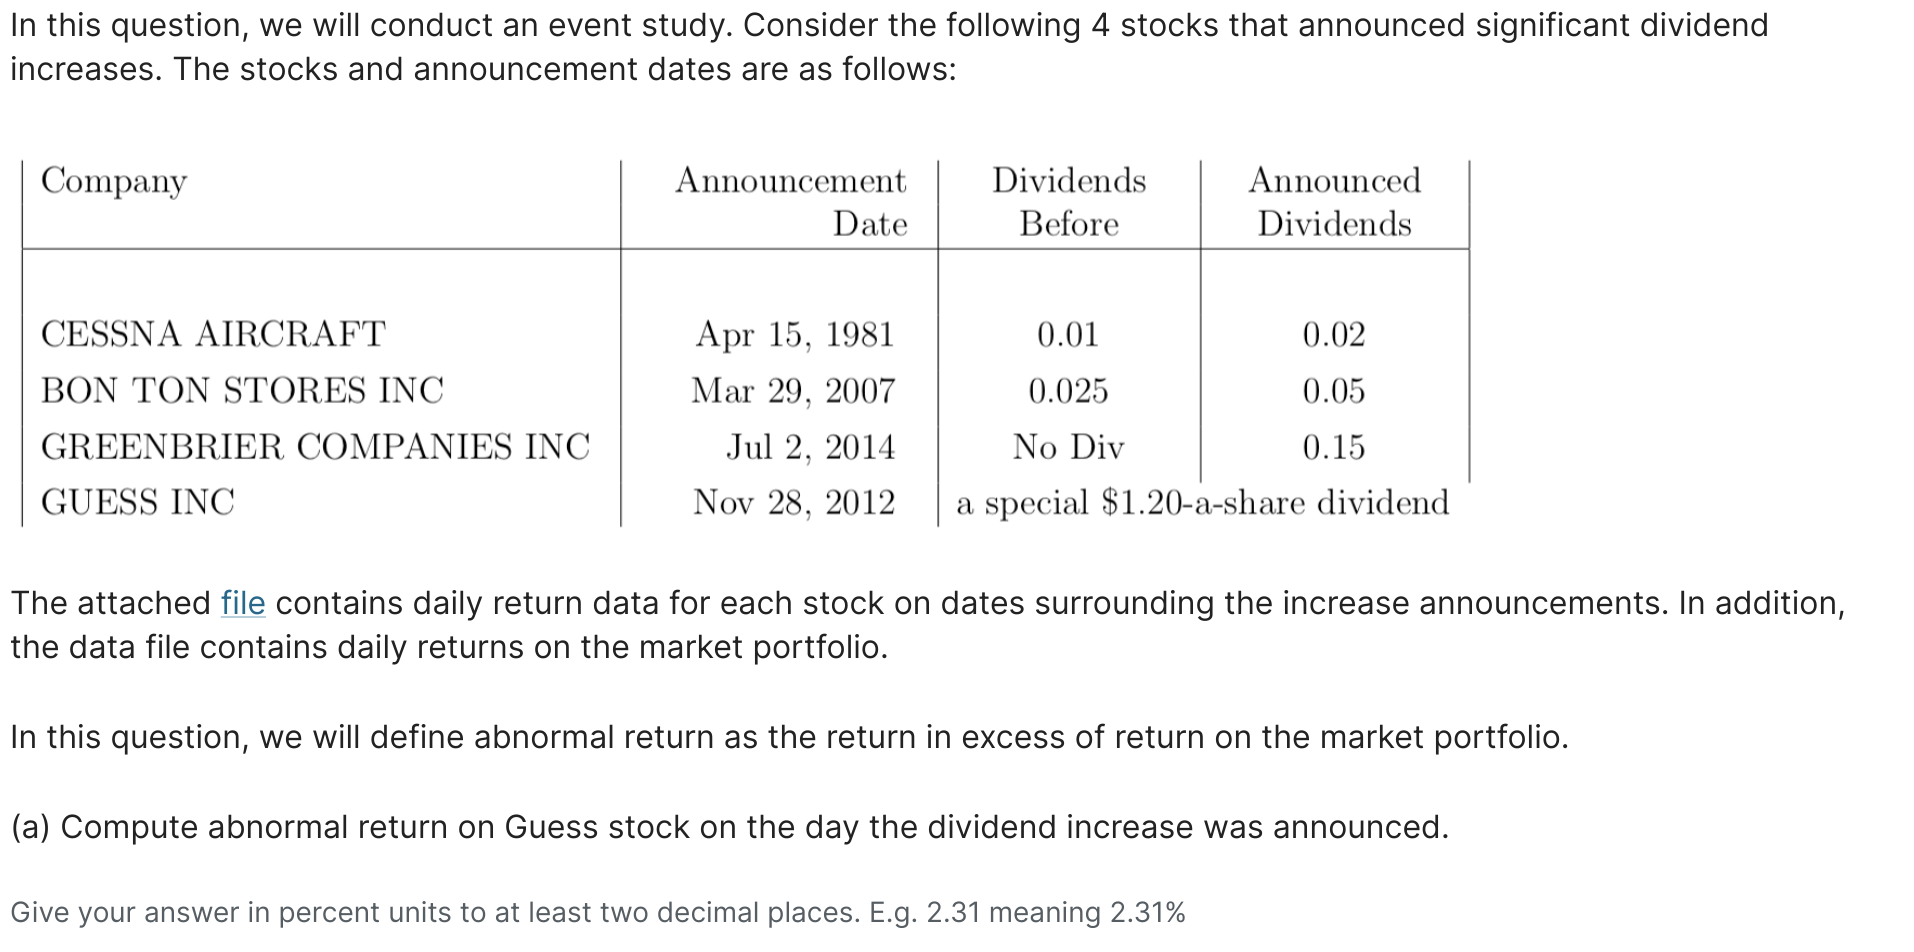

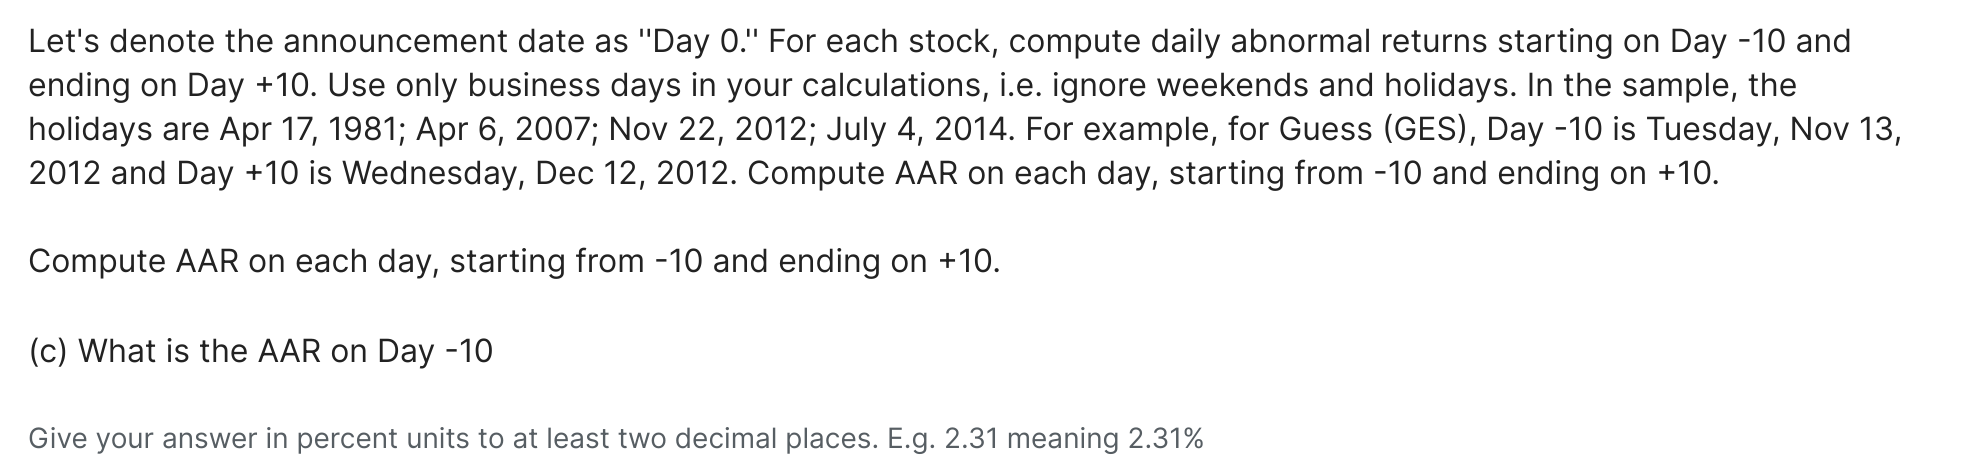

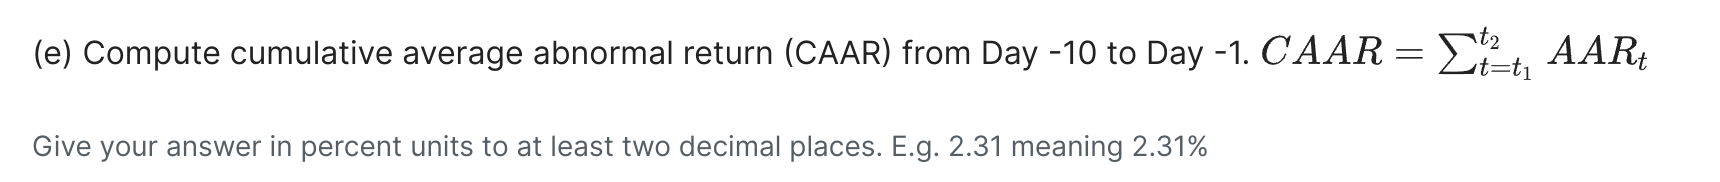

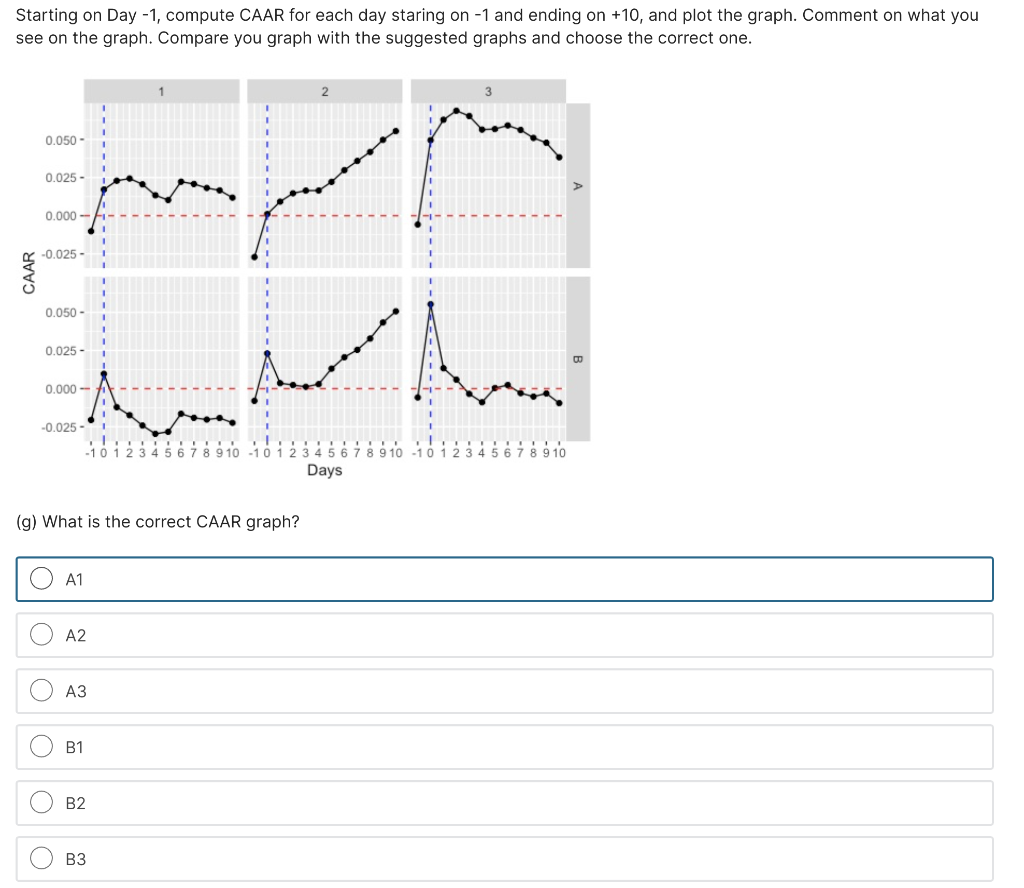
In this question, we will conduct an event study. Consider the following 4 stocks that announced significant dividend increases. The stocks and announcement dates are as follows: Company Announcement Date Dividends Before Announced Dividends CESSNA AIRCRAFT 0.01 0.02 BON TON STORES INC 0.025 0.05 Apr 15, 1981 Mar 29, 2007 Jul 2, 2014 Nov 28, 2012 No Div 0.15 GREENBRIER COMPANIES INC GUESS INC a special $1.20-a-share dividend The attached file contains daily return data for each stock on dates surrounding the increase announcements. In addition, the data file contains daily returns on the market portfolio. In this question, we will define abnormal return as the return in excess of return on the market portfolio. (a) Compute abnormal return on Guess stock on the day the dividend increase was announced. Give your answer in percent units to at least two decimal places. E.g. 2.31 meaning 2.31% (b) Compute abnormal return on the announcement date for the remaining 3 stocks. What is the average abnormal return (AAR) across all 4 stocks? Recall from the lecture that AAR equals to AAR 2-1 ARit for N stocks. = Give your answer in percent units to at least two decimal places. E.g. 2.31 meaning 2.31% Let's denote the announcement date as "Day 0." For each stock, compute daily abnormal returns starting on Day -10 and ending on Day +10. Use only business days in your calculations, i.e. ignore weekends and holidays. In the sample, the holidays are Apr 17, 1981; Apr 6, 2007; Nov 22, 2012; July 4, 2014. For example, for Guess (GES), Day -10 is Tuesday, Nov 13, 2012 and Day +10 is Wednesday, Dec 12, 2012. Compute AAR on each day, starting from -10 and ending on +10. Compute AAR on each day, starting from -10 and ending on +10. (c) What is the AAR on Day -10 Give your answer in percent units to at least two decimal places. E.g. 2.31 meaning 2.31% (d) What is the AAR on Day +10? Give your answer in percent units to at least two decimal places. E.g. 2.31 meaning 2.31% (e) Compute cumulative average abnormal return (CAAR) from Day - 10 to Day -1. CAAR = t=t, AAR = =ti Give your answer in percent units to at least two decimal places. E.g. 2.31 meaning 2.31% (f) Compute cumulative average abnormal return (CAAR) from Day +1 to Day +10. Give your answer in percent units to at least two decimal places. E.g. 2.31 meaning 2.31% Starting on Day -1, compute CAAR for each day staring on -1 and ending on +10, and plot the graph. Comment on what you see on the graph. Compare you graph with the suggested graphs and choose the correct one. 2 3 0.050 - 0.025 - 0.000 - -0.025 - CAAR 0.050 - 0.025- 00 0.000 - -0,025 -1 0 1 2 3 4 5 6 7 8 9 10 !!! 2 3 4 5 6 7 8 9 10 4 5 6 7 8 9 10 -1 0 Days (g) What is the correct CAAR graph? A1 A2 A3 O o B1 O B2 B3 In this question, we will conduct an event study. Consider the following 4 stocks that announced significant dividend increases. The stocks and announcement dates are as follows: Company Announcement Date Dividends Before Announced Dividends CESSNA AIRCRAFT 0.01 0.02 BON TON STORES INC 0.025 0.05 Apr 15, 1981 Mar 29, 2007 Jul 2, 2014 Nov 28, 2012 No Div 0.15 GREENBRIER COMPANIES INC GUESS INC a special $1.20-a-share dividend The attached file contains daily return data for each stock on dates surrounding the increase announcements. In addition, the data file contains daily returns on the market portfolio. In this question, we will define abnormal return as the return in excess of return on the market portfolio. (a) Compute abnormal return on Guess stock on the day the dividend increase was announced. Give your answer in percent units to at least two decimal places. E.g. 2.31 meaning 2.31% (b) Compute abnormal return on the announcement date for the remaining 3 stocks. What is the average abnormal return (AAR) across all 4 stocks? Recall from the lecture that AAR equals to AAR 2-1 ARit for N stocks. = Give your answer in percent units to at least two decimal places. E.g. 2.31 meaning 2.31% Let's denote the announcement date as "Day 0." For each stock, compute daily abnormal returns starting on Day -10 and ending on Day +10. Use only business days in your calculations, i.e. ignore weekends and holidays. In the sample, the holidays are Apr 17, 1981; Apr 6, 2007; Nov 22, 2012; July 4, 2014. For example, for Guess (GES), Day -10 is Tuesday, Nov 13, 2012 and Day +10 is Wednesday, Dec 12, 2012. Compute AAR on each day, starting from -10 and ending on +10. Compute AAR on each day, starting from -10 and ending on +10. (c) What is the AAR on Day -10 Give your answer in percent units to at least two decimal places. E.g. 2.31 meaning 2.31% (d) What is the AAR on Day +10? Give your answer in percent units to at least two decimal places. E.g. 2.31 meaning 2.31% (e) Compute cumulative average abnormal return (CAAR) from Day - 10 to Day -1. CAAR = t=t, AAR = =ti Give your answer in percent units to at least two decimal places. E.g. 2.31 meaning 2.31% (f) Compute cumulative average abnormal return (CAAR) from Day +1 to Day +10. Give your answer in percent units to at least two decimal places. E.g. 2.31 meaning 2.31% Starting on Day -1, compute CAAR for each day staring on -1 and ending on +10, and plot the graph. Comment on what you see on the graph. Compare you graph with the suggested graphs and choose the correct one. 2 3 0.050 - 0.025 - 0.000 - -0.025 - CAAR 0.050 - 0.025- 00 0.000 - -0,025 -1 0 1 2 3 4 5 6 7 8 9 10 !!! 2 3 4 5 6 7 8 9 10 4 5 6 7 8 9 10 -1 0 Days (g) What is the correct CAAR graph? A1 A2 A3 O o B1 O B2 B3