

Question: In this section, use Matlab to process student grades obtained from a spreadsheet file. Download the file course grades 2018.csv, which is a comma-separated values
In this section, use Matlab to process student grades obtained from a spreadsheet file. Download the file course grades 2018.csv, which is a comma-separated values (csv) file exported from the supplied course grades 2018.xlsx spreadsheet (Before exporting the csv file, lines 1-3 and 5 were first deleted from the spreadsheet).
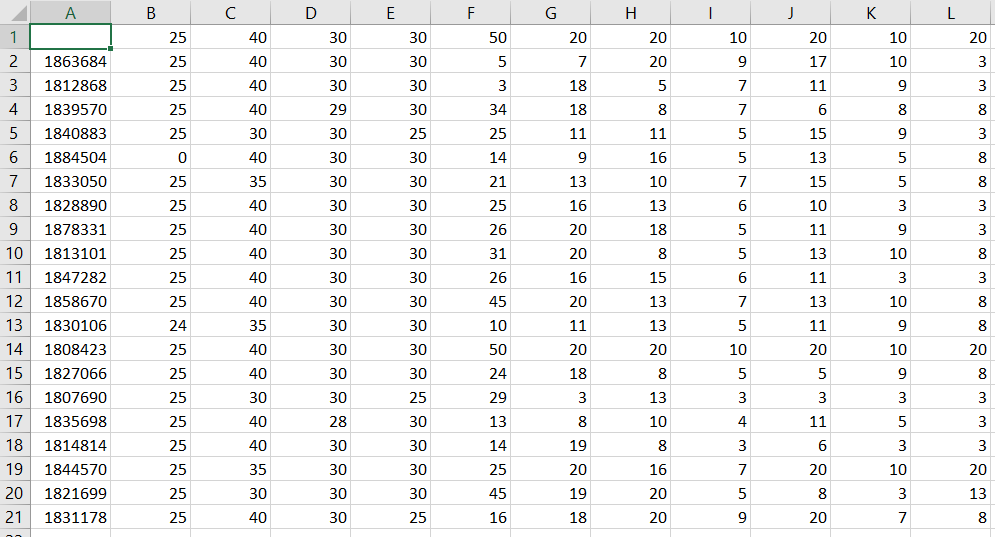
The file contains student grade records that start on Line 2 with student ID number 1863684. You can see from course grades 2018.xlsx that the student marks include 4 labs, a midterm, and 6 exam questions. Note that the entries on Line 1 give the maximum grades for each grade entry type (See course grades 2018.xlsx.)
You can use the Matlab csvread function to read the csv file, where specified sub-block offsets can be accessed. For example, if you use
csvread(course_grades.csv, 1, 0, [1, 0, 5, 0])
then it will read starting at file offset 1,0 and read the block [1, 0, 5, 0], i.e., it will return a vector of the first 5 student ID numbers
[1863684 1812868 1839570 1840883 1884504]
Perform the following tasks. Use vector operations in your Matlab code rather than using Matlab program loops.
(a) Write a Matlab function that accepts: 1) the set of student grade records as a matrix (read from the csv file), 2) the maximum grade vector, and, 3) a vector of column indices. The function will generate a vector of grade averages, i.e., one entry for each student, for the associated grades corresponding to the column indices. For example, if the function is named csv_get_averages, then if we call it with csv_get_averages(m, max, [2:5]) (where m is the student grade record matrix), and max is the maximum grades vector, it will return a vector of average lab marks (i.e., using columns 2 to 5), one entry for each student record.
(b) Write a Matlab script that uses the function that you wrote to output the following: 1) average lab marks for each student, 2) overall average lab grade for the course, 3) average exam marks for each student, and, 4) overall average exam grade for the course.
c) Write a Matlab script to obtain an array of the final grade for each student assuming that the exam is worth 40%, labs are 30% and the midterm is 30%. Create a plot of the final grades, in decreasing order of final grade.
course grades 2018.csv
033838833838808333038 2 2 009895539030909353037 071653501313105316080 211 1 2 2 097755765567505343759 005816038853308308600 122 1112 078819360060108389098 1122-2121 1211 053454156165004934556 321222324152211241 000050000000000500005 333323333333333233332 000900000000000080000 333233333333333323333 000000500000500000500 444434344444344344334 555550555555455555555 001120636084098 593087026991797 31261 83780 0668561 329 3271 5302031 8 01 2345678901 122 1 2 3456 7 89 033838833838808333038 2 2 009895539030909353037 071653501313105316080 211 1 2 2 097755765567505343759 005816038853308308600 122 1112 078819360060108389098 1122-2121 1211 053454156165004934556 321222324152211241 000050000000000500005 333323333333333233332 000900000000000080000 333233333333333323333 000000500000500000500 444434344444344344334 555550555555455555555 001120636084098 593087026991797 31261 83780 0668561 329 3271 5302031 8 01 2345678901 122 1 2 3456 7 89
Step by Step Solution
There are 3 Steps involved in it

Get step-by-step solutions from verified subject matter experts