

Question
In this section you will calculate the Canadian Tire Corporation Class A expected rate of return using the capital asset pricing model. You will first
In this section you will calculate the Canadian Tire Corporation Class A expected rate of return using the capital asset pricing model. You will first need to calculate your company's beta and then use that in the CAPM formula to get the expected rate of return. Data Required: Monthly closing stock prices (in Canadian dollars) for your company for the period May 1, 2019 to April 30, 2023. A good source is Yahoo Finance Canada, as it allows you to search and download the entire period at once. You can specify the date range, choose monthly prices, and download the information Use the Close price rather than the Adjusted Close price. NOTE: Yahoo Finance provides Open-High-Low-Close prices for each month and lists the date as the first trading day of the month. The closing price is from the last trading day of the month. Monthly closing prices for the S&P/TSX Composite Index for the period May 1, 2019 to April 30, 2023. A good source is Yahoo Finance Canada. The company symbol will be ^GSPTSE. The yield on a 3-month Canada Treasury Bill for April 28, 2023. You will find this at the Bank of Canada. From the dropdown menu under "Statistics", choose "interest Rates", then choose "Treasury Bill Yields". Click on "Look up the past ten years of data for these series. Select your date and choose Treasury Bills, 3 Month, Daily. You will be given the yield as a percentage. Calculations: Calculate each of the monthly returns for your stock over the 4 years from May 2019 to April 2023 (i.e., percentage change in price each month). Create a scatter plot using Excel that shows the returns on your company's stock and the returns on the market index. Each point will represent one month (see Figure 12.2 in your text). Plot the characteristic line on the graph (the trendline). Make sure to label your axes. Calculate the standard deviation of your company's returns, the standard deviation of S&P/TSX returns, and the correlation coefficient of S&P/TSX and company returns. Calculate beta as the slope of the characteristic line on your graph (see a sample spreadsheet in section 12.1 of your text). Using the value of beta that you calculated, the April 28, 2023 yield on a three-month treasury bill for the risk-free rate, and 7 percent as the market risk premium (the average market risk premium over the last 90 years), calculate the expected rate of return based on the capital asset pricing model. Report the data and results for these two sets of calculations on the CAPM Template. Make sure you include sources for your data and show the formulas you used (using variable names) as well as the calculations (using your numbers). You do not need to show the formulas or calculations for standard deviation, correlation, or beta. Include a graph of your data and make sure you label the axes.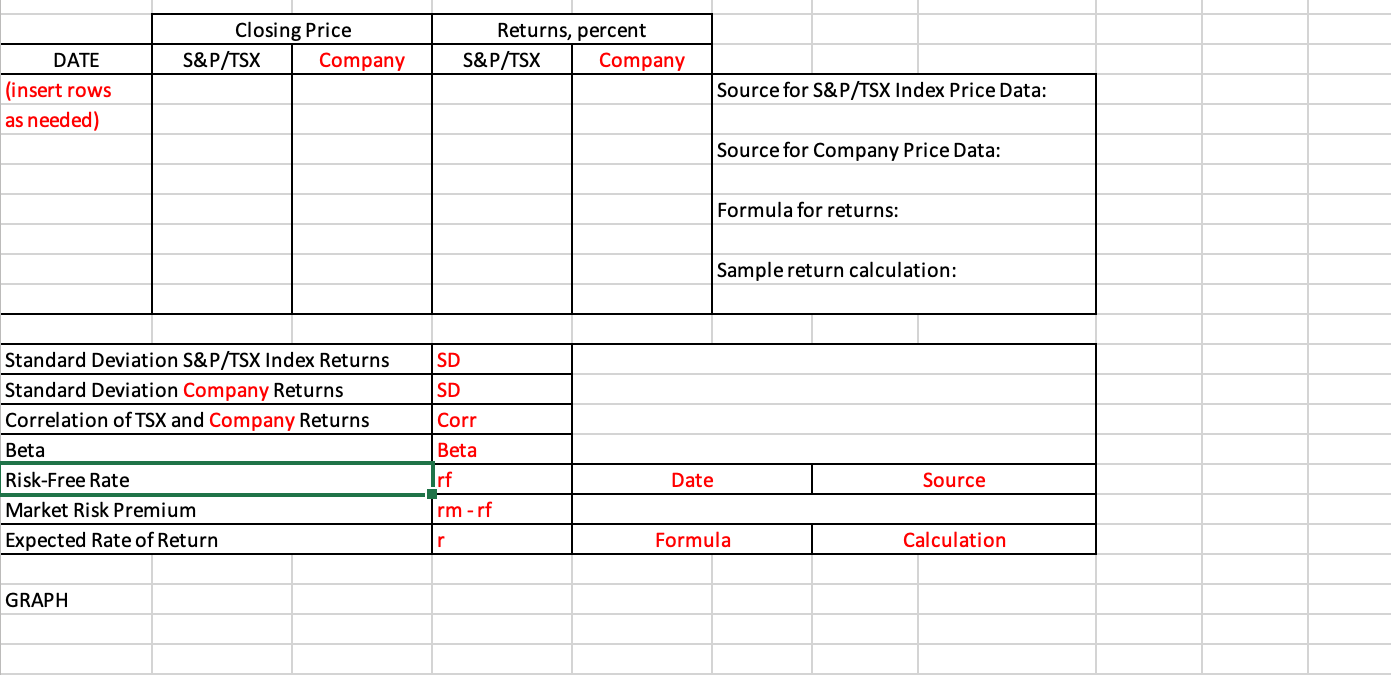
Step by Step Solution
There are 3 Steps involved in it
Step: 1

Get Instant Access to Expert-Tailored Solutions
See step-by-step solutions with expert insights and AI powered tools for academic success
Step: 2

Step: 3
Ace Your Homework with AI
Get the answers you need in no time with our AI-driven, step-by-step assistance
Get Started
Understanding The Use Of Financial Accounting Provisions In Private Acquisition Agreements
Authors: Mark L. Stoneman
1st Edition
1627222731, 978-1627222730