In this task, you'll study the data from two experiments.For each data set, you will determine whether the difference of means between the treatment group and the control group is statistically significant and interpret the result in the context of the situation.
Question 1
Researchers want to find a way to increase the growth rate of corn so it can be harvested more often.To test the effectiveness of a new type of spray fertilizer, plants grown from200 cornseeds were divided equally into two groups:a treatment group and a control group.The treatment group was frequently sprayed with the new type of fertilizer.The growth in centimeters of each corn plant was noted before and after the treatment.
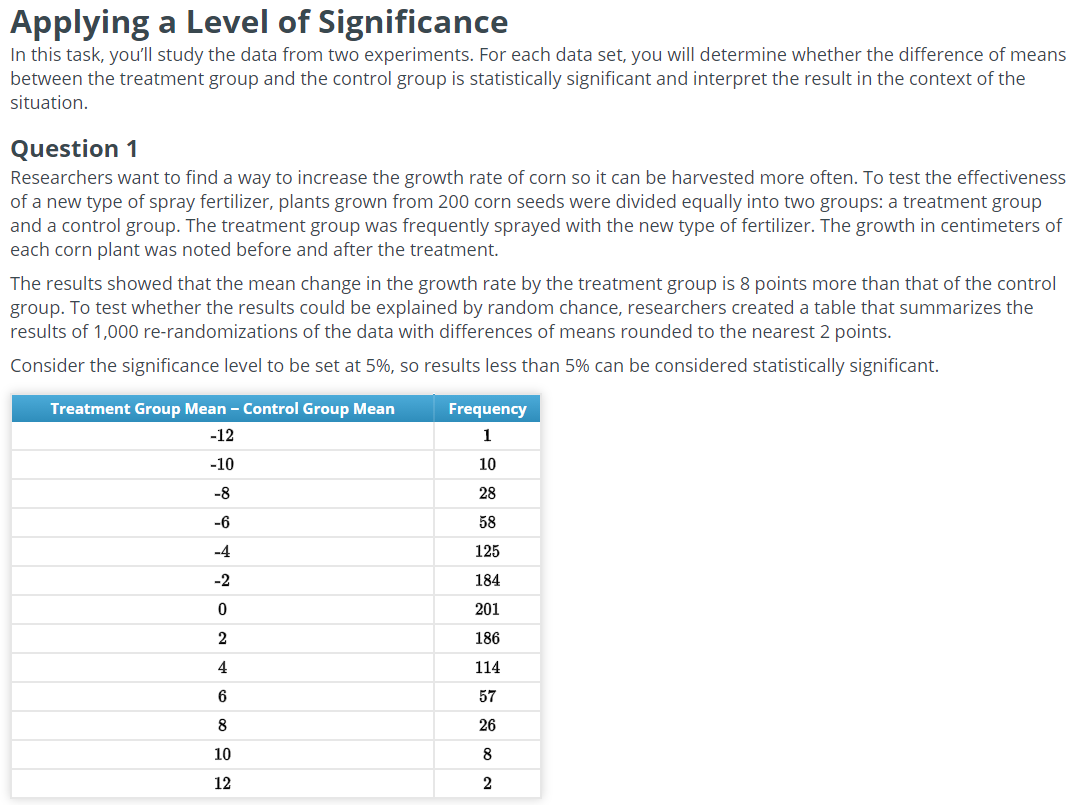
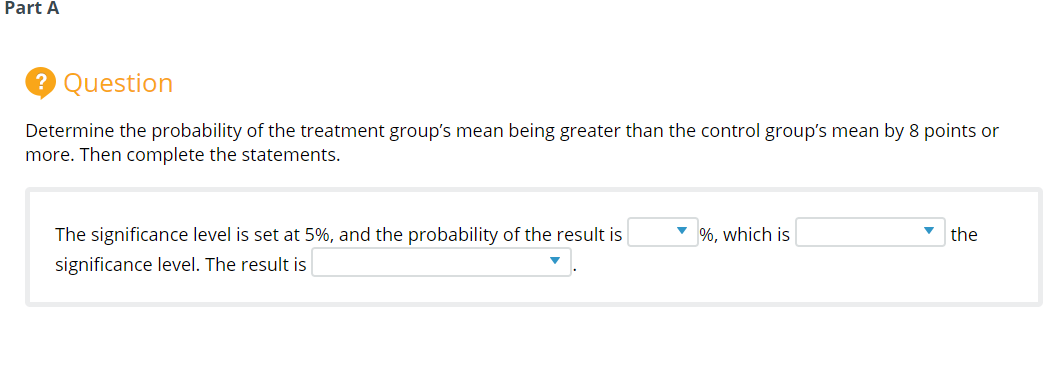
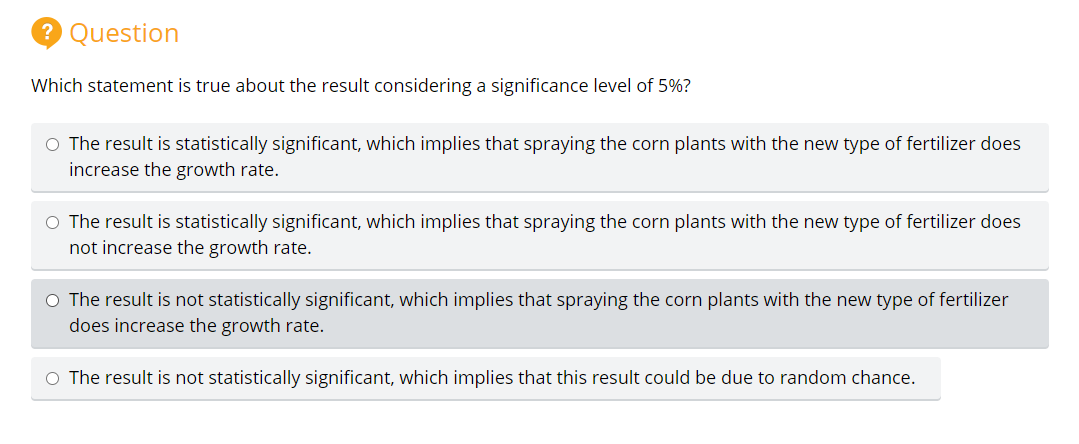
The results showed that the mean change in the growth rate by the treatment group is8 pointsmore than that of the control group.To test whether the results could be explained by random chance, researchers created a table that summarizes the results of 1,000re-randomizationsof the data with differences of means rounded to the nearest2 points.
Consider the significance level to be set at 5%, so results less than 5% can be considered statistically significant.
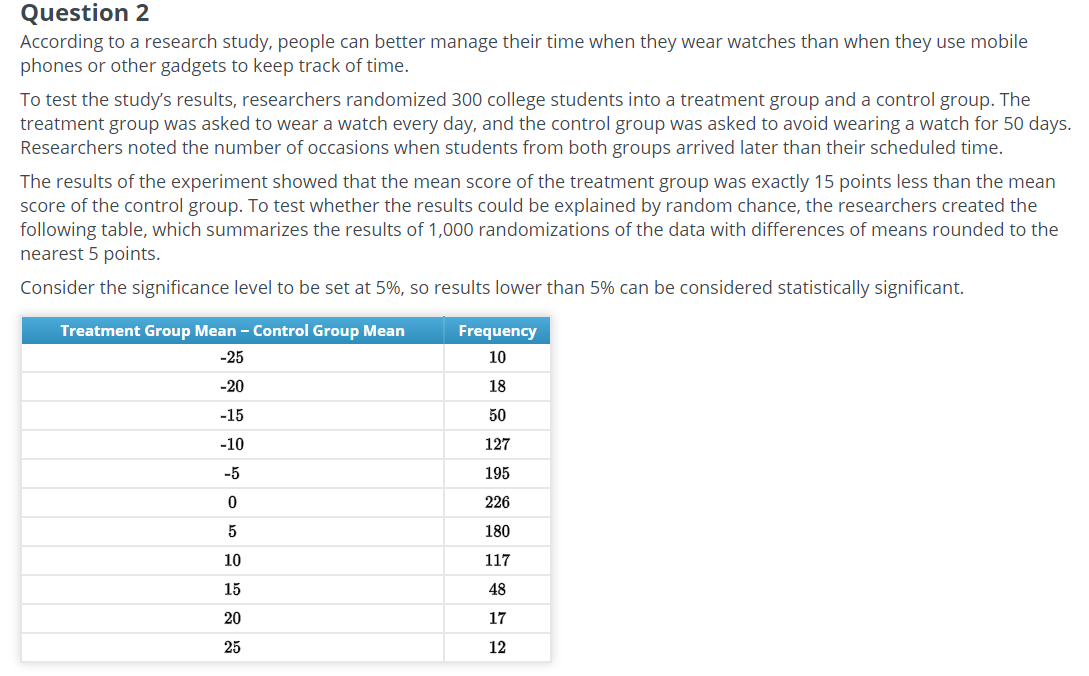
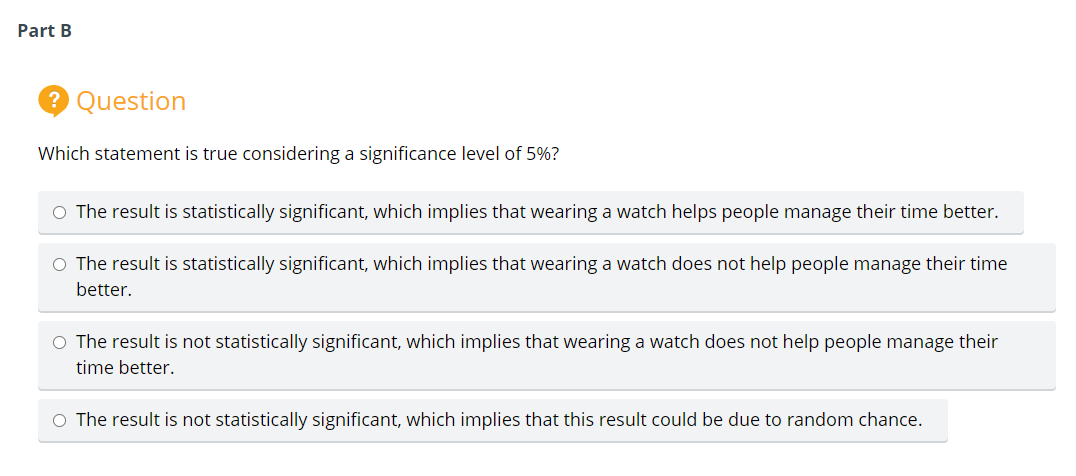
Applying a Level of Significance In this task, you'll study the data from two experiments. For each data set, you will determine whether the difference of means between the treatment group and the control group is statistically signicant and interpret the result in the context of the situation. Question 1 Researchers want to find a way to increase the growth rate of corn so it can be harvested more often. To test the effectiveness of a new type of spray fertilizer, plants grown from 200 com seeds were divided equally into two groups: a treatment group and a control group. The treatment group was frequently sprayed with the new type of fertilizer. The growth in centimeters of each corn plant was noted before and after the treatment. The results showed that the mean change in the growth rate by the treatment group is 8 points more than that of the control group. To test whether the results could be explained by random chance, researchers created a table that summarizes the results of 1,000 re-randomizations of the data with differences of means rounded to the nearest 2 points. Consider the significance level to be set at 5%, so results less than 5% can be considered statistically signicant. Treatment Group Mean Control Group Mean Frequency -12 1 -1 10 .3 28 -6 58 -4 125 -2 184 0 201 2 186 4 114 6 5T 8 26 10 8 12 2 Part A Question Determine the probability of the treatment group's mean being greater than the control group's mean by 8 points or more. Then complete the statements. The significance level is set at 5%, and the probability of the result is V %, which is the significance level. The result is? Question Which statement is true about the result considering a significance level of 5%? O The result is statistically significant, which implies that spraying the corn plants with the new type of fertilizer does increase the growth rate. O The result is statistically significant, which implies that spraying the corn plants with the new type of fertilizer does not increase the growth rate. O The result is not statistically significant, which implies that spraying the corn plants with the new type of fertilizer does increase the growth rate. O The result is not statistically significant, which implies that this result could be due to random chance.Question 2 According to a research study. people can better manage their time when they wear watches than when they use mobile phones or other gadgets to keep track of time. To test the study's results, researchers randomized 300 college students into a treatment group and a control group. The treatment group was asked to wear a watch every day, and the control group was asked to avoid wearing a watch for 50 days. Researchers noted the number of occasions when students from both groups arrived later than their scheduled time. The results of the experiment showed that the mean score of the treatment group was exactly 15 points less than the mean score of the control group. To test whether the results could be explained by random chance, the researchers created the following table, which summarizes the results of 1,000 randomizations of the data with differences of means rounded to the nearest 5 points. Consider the significance level to be set at 5%, so results lower than 5% can be considered statistically significant. Treatment Group Mean Control Group Mean Frequency -25 10 -2D 18 -15 50 -1[} 127 -5 195 0 226 5 180 10 117 15 48 20 17 25 12 Part A ? Question Determine the probability of the treatment group's mean being lower than the control group's mean by 15 points or more. Then complete the statements. The significance level is set at 5%, and the probability of the result is %, which is the significance level. The result isPart B ? Question Which statement is true considering a significance level of 5%? O The result is statistically significant, which implies that wearing a watch helps people manage their time better. O The result is statistically significant, which implies that wearing a watch does not help people manage their time better. O The result is not statistically significant, which implies that wearing a watch does not help people manage their time better. O The result is not statistically significant, which implies that this result could be due to random chance
