In Touch with Data: Convergence or Divergence?
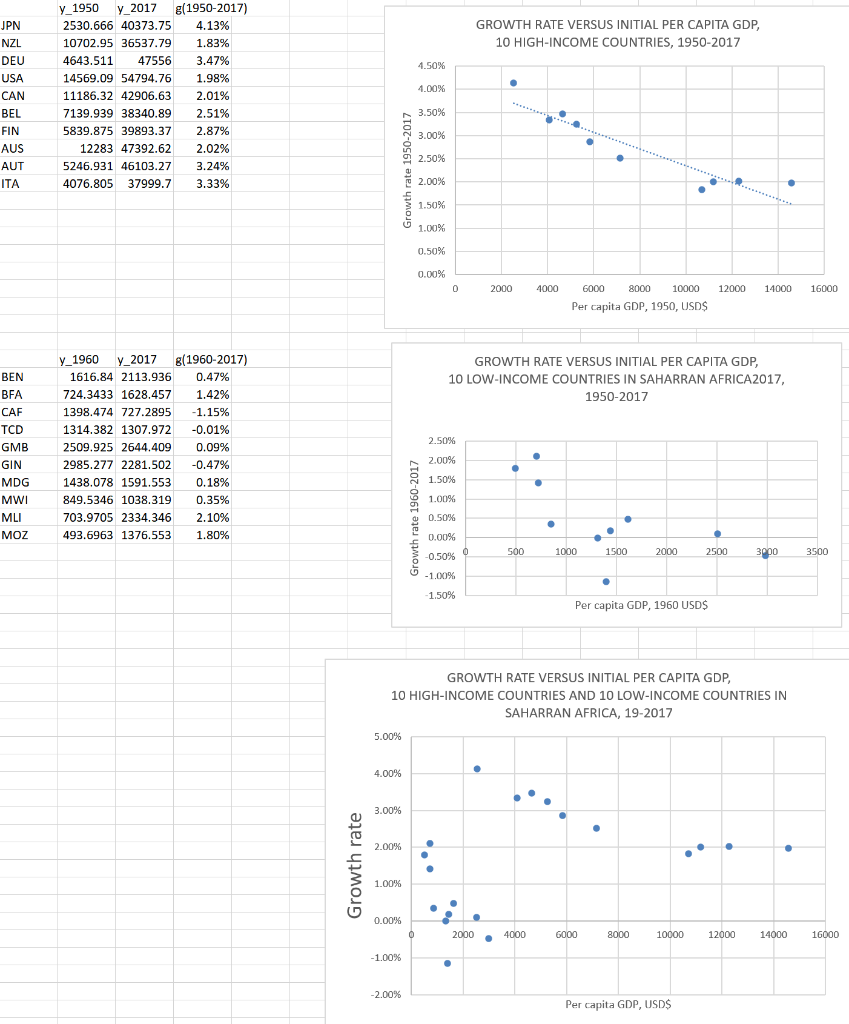
Can you observe cross-country income convergence in these figures?
Can the Solow model explain the patterns above? Explain

y 1950 GROWTH RATE VERSUS INITIAL PER CAPITA GDP, 10 HIGH-INCOME COUNTRIES, 1950-2017 4.50% O 4.00% JPN NZL DEU USA CAN BEL FIN AUS AUT ITA y 2017 g(1950-2017) 2530.666 40373.75 4.13% 10702.95 36537.79 1.83% 4643.511 47556 3.47% 14569.09 54794.76 1.98% 11186.32 42906.63 2.01% 7139.939 38340.89 2.51% 5839.875 39893.37 2.87% 12283 47392.62 2.02% 5246.931 46103.27 3.24% 4076.805 37999.7 3.33% 3.50% . 3.00% 2.50% Growth rate 1950-2017 2.00% . . 1.50% 1.00% 0.50% 0.00% 0 2000 4000 12000 14000 16000 6000 8000 10000 Per capita GDP, 1950, USD$ GROWTH RATE VERSUS INITIAL PER CAPITA GDP, 10 LOW-INCOME COUNTRIES IN SAHARRAN AFRICA 2017, 1950-2017 2.50% BEN BFA CAF TCD GMB GIN MDG MWI MLI MOZ y_1960 y_2017 8(1960-2017) 1616.84 2113.936 0.47% 724.3433 1628.457 1.42% 1398.474 727.2895 -1.15% 1314.382 1307.972 -0.01% 2509.925 2644.409 0.09% 2985.277 2281.502 -0.47% 1438.078 1591.553 0.18% 849.5346 1038.319 0.35% 703.9705 2334.346 2.10% 493.6963 1376.553 1.80% 2.00% . 1.50% . 1.00% Growth rate 1960-2017 0.50% . 0.00% 0 500 1500 1000 2000 2500 3000 3500 -0.50% -1.00% 1.50% Per capita GDP, 1960 USD$ GROWTH RATE VERSUS INITIAL PER CAPITA GDP, 10 HIGH-INCOME COUNTRIES AND 10 LOW-INCOME COUNTRIES IN SAHARRAN AFRICA, 19-2017 5.00% 4.00% 3.00% 2.00% Growth rate 1.00% . 0.00% 0 2000 4000 6000 10000 8000 12000 . 16000 14000 -1.00% -2.00% Per capita GDP, USD$ y 1950 GROWTH RATE VERSUS INITIAL PER CAPITA GDP, 10 HIGH-INCOME COUNTRIES, 1950-2017 4.50% O 4.00% JPN NZL DEU USA CAN BEL FIN AUS AUT ITA y 2017 g(1950-2017) 2530.666 40373.75 4.13% 10702.95 36537.79 1.83% 4643.511 47556 3.47% 14569.09 54794.76 1.98% 11186.32 42906.63 2.01% 7139.939 38340.89 2.51% 5839.875 39893.37 2.87% 12283 47392.62 2.02% 5246.931 46103.27 3.24% 4076.805 37999.7 3.33% 3.50% . 3.00% 2.50% Growth rate 1950-2017 2.00% . . 1.50% 1.00% 0.50% 0.00% 0 2000 4000 12000 14000 16000 6000 8000 10000 Per capita GDP, 1950, USD$ GROWTH RATE VERSUS INITIAL PER CAPITA GDP, 10 LOW-INCOME COUNTRIES IN SAHARRAN AFRICA 2017, 1950-2017 2.50% BEN BFA CAF TCD GMB GIN MDG MWI MLI MOZ y_1960 y_2017 8(1960-2017) 1616.84 2113.936 0.47% 724.3433 1628.457 1.42% 1398.474 727.2895 -1.15% 1314.382 1307.972 -0.01% 2509.925 2644.409 0.09% 2985.277 2281.502 -0.47% 1438.078 1591.553 0.18% 849.5346 1038.319 0.35% 703.9705 2334.346 2.10% 493.6963 1376.553 1.80% 2.00% . 1.50% . 1.00% Growth rate 1960-2017 0.50% . 0.00% 0 500 1500 1000 2000 2500 3000 3500 -0.50% -1.00% 1.50% Per capita GDP, 1960 USD$ GROWTH RATE VERSUS INITIAL PER CAPITA GDP, 10 HIGH-INCOME COUNTRIES AND 10 LOW-INCOME COUNTRIES IN SAHARRAN AFRICA, 19-2017 5.00% 4.00% 3.00% 2.00% Growth rate 1.00% . 0.00% 0 2000 4000 6000 10000 8000 12000 . 16000 14000 -1.00% -2.00% Per capita GDP, USD$


