

Answered step by step
Verified Expert Solution
Question
1 Approved Answer
In your analysis, recalculate the product costs for CTC/A105 and CTC/B107 using activity-based costing and compare them to those costs calculated in Case 1. What
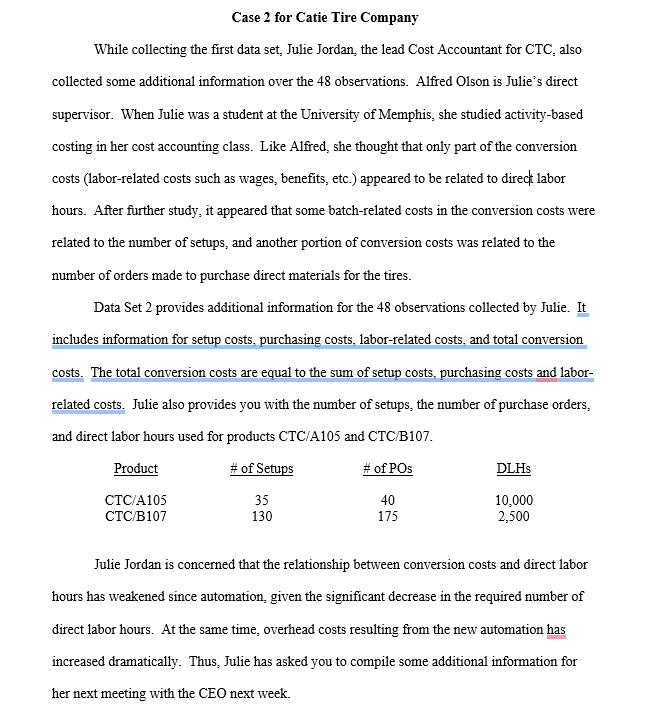
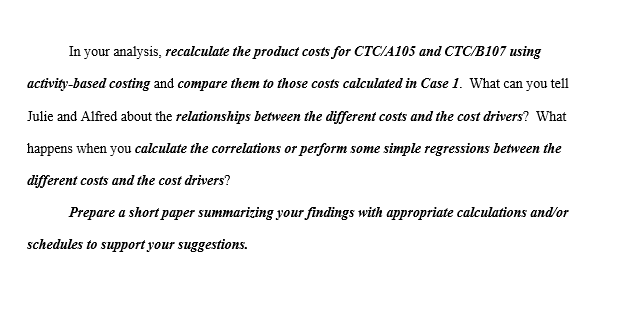
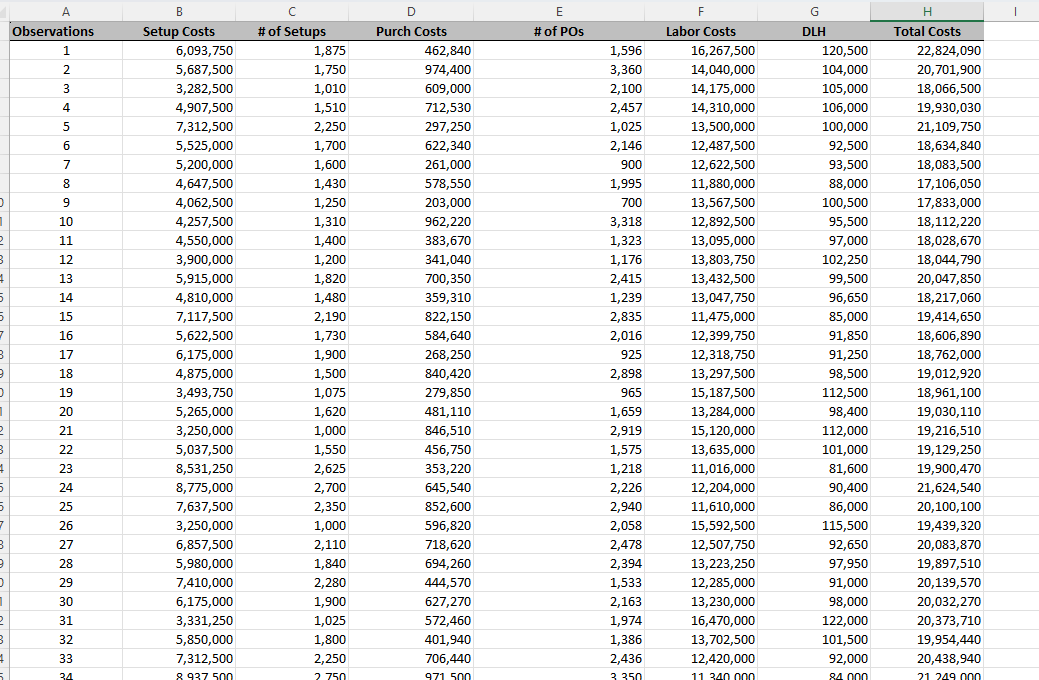
 In your analysis, recalculate the product costs for CTC/A105 and CTC/B107 using activity-based costing and compare them to those costs calculated in Case 1. What can you tell Julie and Alfred about the relationships between the different costs and the cost drivers? What happens when you calculate the correlations or perform some simple regressions between the different costs and the cost drivers? Prepare a short paper summarizing your findings with appropriate calculations andor schedules to support your suggestions. \begin{tabular}{|c|c|c|c|c|c|c|c|} \hline A & B & C & D & E & F & G & H \\ \hline Observations & Setup Costs & \# of Setups & Purch Costs & \# of POs & Labor Costs & DLH & Total Costs \\ \hline 1 & 6,093,750 & 1,875 & 462,840 & 1,596 & 16,267,500 & 120,500 & 22,824,090 \\ \hline 2 & 5,687,500 & 1,750 & 974,400 & 3,360 & 14,040,000 & 104,000 & 20,701,900 \\ \hline 3 & 3,282,500 & 1,010 & 609,000 & 2,100 & 14,175,000 & 105,000 & 18,066,500 \\ \hline 4 & 4,907,500 & 1,510 & 712,530 & 2,457 & 14,310,000 & 106,000 & 19,930,030 \\ \hline 5 & 7,312,500 & 2,250 & 297,250 & 1,025 & 13,500,000 & 100,000 & 21,109,750 \\ \hline 6 & 5,525,000 & 1,700 & 622,340 & 2,146 & 12,487,500 & 92,500 & 18,634,840 \\ \hline 7 & 5,200,000 & 1,600 & 261,000 & 900 & 12,622,500 & 93,500 & 18,083,500 \\ \hline 8 & 4,647,500 & 1,430 & 578,550 & 1,995 & 11,880,000 & 88,000 & 17,106,050 \\ \hline 9 & 4,062,500 & 1,250 & 203,000 & 700 & 13,567,500 & 100,500 & 17,833,000 \\ \hline 10 & 4,257,500 & 1,310 & 962,220 & 3,318 & 12,892,500 & 95,500 & 18,112,220 \\ \hline 11 & 4,550,000 & 1,400 & 383,670 & 1,323 & 13,095,000 & 97,000 & 18,028,670 \\ \hline 12 & 3,900,000 & 1,200 & 341,040 & 1,176 & 13,803,750 & 102,250 & 18,044,790 \\ \hline 13 & 5,915,000 & 1,820 & 700,350 & 2,415 & 13,432,500 & 99,500 & 20,047,850 \\ \hline 14 & 4,810,000 & 1,480 & 359,310 & 1,239 & 13,047,750 & 96,650 & 18,217,060 \\ \hline 15 & 7,117,500 & 2,190 & 822,150 & 2,835 & 11,475,000 & 85,000 & 19,414,650 \\ \hline 16 & 5,622,500 & 1,730 & 584,640 & 2,016 & 12,399,750 & 91,850 & 18,606,890 \\ \hline 17 & 6,175,000 & 1,900 & 268,250 & 925 & 12,318,750 & 91,250 & 18,762,000 \\ \hline 18 & 4,875,000 & 1,500 & 840,420 & 2,898 & 13,297,500 & 98,500 & 19,012,920 \\ \hline 19 & 3,493,750 & 1,075 & 279,850 & 965 & 15,187,500 & 112,500 & 18,961,100 \\ \hline 20 & 5,265,000 & 1,620 & 481,110 & 1,659 & 13,284,000 & 98,400 & 19,030,110 \\ \hline 21 & 3,250,000 & 1,000 & 846,510 & 2,919 & 15,120,000 & 112,000 & 19,216,510 \\ \hline 22 & 5,037,500 & 1,550 & 456,750 & 1,575 & 13,635,000 & 101,000 & 19,129,250 \\ \hline 23 & 8,531,250 & 2,625 & 353,220 & 1,218 & 11,016,000 & 81,600 & 19,900,470 \\ \hline 24 & 8,775,000 & 2,700 & 645,540 & 2,226 & 12,204,000 & 90,400 & 21,624,540 \\ \hline 25 & 7,637,500 & 2,350 & 852,600 & 2,940 & 11,610,000 & 86,000 & 20,100,100 \\ \hline 26 & 3,250,000 & 1,000 & 596,820 & 2,058 & 15,592,500 & 115,500 & 19,439,320 \\ \hline 27 & 6,857,500 & 2,110 & 718,620 & 2,478 & 12,507,750 & 92,650 & 20,083,870 \\ \hline 28 & 5,980,000 & 1,840 & 694,260 & 2,394 & 13,223,250 & 97,950 & 19,897,510 \\ \hline 29 & 7,410,000 & 2,280 & 444,570 & 1,533 & 12,285,000 & 91,000 & 20,139,570 \\ \hline 30 & 6,175,000 & 1,900 & 627,270 & 2,163 & 13,230,000 & 98,000 & 20,032,270 \\ \hline 31 & 3,331,250 & 1,025 & 572,460 & 1,974 & 16,470,000 & 122,000 & 20,373,710 \\ \hline 32 & 5,850,000 & 1,800 & 401,940 & 1,386 & 13,702,500 & 101,500 & 19,954,440 \\ \hline 33 & 7,312,500 & 2,250 & 706,440 & 2,436 & 12,420,000 & 92,000 & 20,438,940 \\ \hline 34 & 8937500 & 2750 & 971500 & 3350 & 11340 11 & 84000 & 21249000 \\ \hline \end{tabular} While collecting the first data set, Julie Jordan, the lead Cost Accountant for CTC, also collected some additional information over the 48 observations. Alfred Olson is Julie's direct supervisor. When Julie was a student at the University of Memphis, she studied activity-based costing in her cost accounting class. Like Alfred, she thought that only part of the conversion costs (labor-related costs such as wages, benefits, etc.) appeared to be related to direct labor hours. After further study, it appeared that some batch-related costs in the conversion costs were related to the number of setups, and another portion of conversion costs was related to the number of orders made to purchase direct materials for the tires. Data Set 2 provides additional information for the 48 observations collected by Julie. It includes information for setup costs, purchasing costs, labor-related costs, and total conversion costs. The total conversion costs are equal to the sum of setup costs, purchasing costs and laborrelated costs. Julie also provides you with the number of setups, the number of purchase orders, and direct labor hours used for products CTC/A105 and CTC/B107. Julie Jordan is concerned that the relationship between conversion costs and direct labor hours has weakened since automation, given the significant decrease in the required number of direct labor hours. At the same time, overhead costs resulting from the new automation has increased dramatically. Thus, Julie has asked you to compile some additional information for her next meeting with the CEO next week. \begin{tabular}{|c|c|c|c|c|c|c|c|} \hline 20 & 5,265,000 & 1,620 & 481,110 & 1,659 & 13,284,000 & 98,400 & 19,030,110 \\ \hline 21 & 3,250,000 & 1,000 & 846,510 & 2,919 & 15,120,000 & 112,000 & 19,216,510 \\ \hline 22 & 5,037,500 & 1,550 & 456,750 & 1,575 & 13,635,000 & 101,000 & 19,129,250 \\ \hline 23 & 8,531,250 & 2,625 & 353,220 & 1,218 & 11,016,000 & 81,600 & 19,900,470 \\ \hline 24 & 8,775,000 & 2,700 & 645,540 & 2,226 & 12,204,000 & 90,400 & 21,624,540 \\ \hline 25 & 7,637,500 & 2,350 & 852,600 & 2,940 & 11,610,000 & 86,000 & 20,100,100 \\ \hline 26 & 3,250,000 & 1,000 & 596,820 & 2,058 & 15,592,500 & 115,500 & 19,439,320 \\ \hline 27 & 6,857,500 & 2,110 & 718,620 & 2,478 & 12,507,750 & 92,650 & 20,083,870 \\ \hline 28 & 5,980,000 & 1,840 & 694,260 & 2,394 & 13,223,250 & 97,950 & 19,897,510 \\ \hline 29 & 7,410,000 & 2,280 & 444,570 & 1,533 & 12,285,000 & 91,000 & 20,139,570 \\ \hline 30 & 6,175,000 & 1,900 & 627,270 & 2,163 & 13,230,000 & 98,000 & 20,032,270 \\ \hline 31 & 3,331,250 & 1,025 & 572,460 & 1,974 & 16,470,000 & 122,000 & 20,373,710 \\ \hline 32 & 5,850,000 & 1,800 & 401,940 & 1,386 & 13,702,500 & 101,500 & 19,954,440 \\ \hline 33 & 7,312,500 & 2,250 & 706,440 & 2,436 & 12,420,000 & 92,000 & 20,438,940 \\ \hline 34 & 8,937,500 & 2,750 & 971,500 & 3,350 & 11,340,000 & 84,000 & 21,249,000 \\ \hline 35 & 3,575,000 & 1,100 & 645,250 & 2,225 & 15,660,000 & 116,000 & 19,880,250 \\ \hline 36 & 7,800,000 & 2,400 & 870,870 & 3,003 & 12,217,500 & 90,500 & 20,888,370 \\ \hline 37 & 3,900,000 & 1,200 & 334,950 & 1,155 & 13,263,750 & 98,250 & 17,498,700 \\ \hline 38 & 6,110,000 & 1,880 & 475,020 & 1,638 & 13,412,250 & 99,350 & 19,997,270 \\ \hline 39 & 4,290,000 & 1,320 & 828,240 & 2,856 & 14,094,000 & 104,400 & 19,212,240 \\ \hline 40 & 4,875,000 & 1,500 & 468,930 & 1,617 & 12,690,000 & 94,000 & 18,033,930 \\ \hline 41 & 4,306,250 & 1,325 & 590,730 & 2,037 & 13,601,250 & 100,750 & 18,498,230 \\ \hline 42 & 7,150,000 & 2,200 & 365,400 & 1,260 & 13,790,250 & 102,150 & 21,305,650 \\ \hline 43 & 6,175,000 & 1,900 & 487,200 & 1,680 & 10,800,000 & 80,000 & 17,462,200 \\ \hline 44 & 4,972,500 & 1,530 & 517,650 & 1,785 & 11,745,000 & 87,000 & 17,235,150 \\ \hline 45 & 3,347,500 & 1,030 & 761,250 & 2,625 & 13,027,500 & 96,500 & 17,136,250 \\ \hline 46 & 5,200,000 & 1,600 & 347,130 & 1,197 & 11,947,500 & 88,500 & 17,494,630 \\ \hline 47 & 2,925,000 & 900 & 730,800 & 2,520 & 16,065,000 & 119,000 & 19,720,800 \\ \hline 48 & 4,322,500 & 1,330 & 476,760 & 1,644 & 12,960,000 & 96,000 & 17,759,260 \\ \hline & Total Setup Costs & Total \# of Setups & Total Purchase CostsT & Total \# of Purchasing orders & Total Labor Costs & Total DLH & Total Costs \\ \hline & 259,983,750 & 79,995 & 27,532,600 & 94,940 & 636,714,000 & 4,716,400 & 924,230,350 \\ \hline & & & & & & & \\ \hline & & & & & & & \\ \hline \end{tabular} In your analysis, recalculate the product costs for CTC/A105 and CTC/B107 using activity-based costing and compare them to those costs calculated in Case 1. What can you tell Julie and Alfred about the relationships between the different costs and the cost drivers? What happens when you calculate the correlations or perform some simple regressions between the different costs and the cost drivers? Prepare a short paper summarizing your findings with appropriate calculations andor schedules to support your suggestions. \begin{tabular}{|c|c|c|c|c|c|c|c|} \hline A & B & C & D & E & F & G & H \\ \hline Observations & Setup Costs & \# of Setups & Purch Costs & \# of POs & Labor Costs & DLH & Total Costs \\ \hline 1 & 6,093,750 & 1,875 & 462,840 & 1,596 & 16,267,500 & 120,500 & 22,824,090 \\ \hline 2 & 5,687,500 & 1,750 & 974,400 & 3,360 & 14,040,000 & 104,000 & 20,701,900 \\ \hline 3 & 3,282,500 & 1,010 & 609,000 & 2,100 & 14,175,000 & 105,000 & 18,066,500 \\ \hline 4 & 4,907,500 & 1,510 & 712,530 & 2,457 & 14,310,000 & 106,000 & 19,930,030 \\ \hline 5 & 7,312,500 & 2,250 & 297,250 & 1,025 & 13,500,000 & 100,000 & 21,109,750 \\ \hline 6 & 5,525,000 & 1,700 & 622,340 & 2,146 & 12,487,500 & 92,500 & 18,634,840 \\ \hline 7 & 5,200,000 & 1,600 & 261,000 & 900 & 12,622,500 & 93,500 & 18,083,500 \\ \hline 8 & 4,647,500 & 1,430 & 578,550 & 1,995 & 11,880,000 & 88,000 & 17,106,050 \\ \hline 9 & 4,062,500 & 1,250 & 203,000 & 700 & 13,567,500 & 100,500 & 17,833,000 \\ \hline 10 & 4,257,500 & 1,310 & 962,220 & 3,318 & 12,892,500 & 95,500 & 18,112,220 \\ \hline 11 & 4,550,000 & 1,400 & 383,670 & 1,323 & 13,095,000 & 97,000 & 18,028,670 \\ \hline 12 & 3,900,000 & 1,200 & 341,040 & 1,176 & 13,803,750 & 102,250 & 18,044,790 \\ \hline 13 & 5,915,000 & 1,820 & 700,350 & 2,415 & 13,432,500 & 99,500 & 20,047,850 \\ \hline 14 & 4,810,000 & 1,480 & 359,310 & 1,239 & 13,047,750 & 96,650 & 18,217,060 \\ \hline 15 & 7,117,500 & 2,190 & 822,150 & 2,835 & 11,475,000 & 85,000 & 19,414,650 \\ \hline 16 & 5,622,500 & 1,730 & 584,640 & 2,016 & 12,399,750 & 91,850 & 18,606,890 \\ \hline 17 & 6,175,000 & 1,900 & 268,250 & 925 & 12,318,750 & 91,250 & 18,762,000 \\ \hline 18 & 4,875,000 & 1,500 & 840,420 & 2,898 & 13,297,500 & 98,500 & 19,012,920 \\ \hline 19 & 3,493,750 & 1,075 & 279,850 & 965 & 15,187,500 & 112,500 & 18,961,100 \\ \hline 20 & 5,265,000 & 1,620 & 481,110 & 1,659 & 13,284,000 & 98,400 & 19,030,110 \\ \hline 21 & 3,250,000 & 1,000 & 846,510 & 2,919 & 15,120,000 & 112,000 & 19,216,510 \\ \hline 22 & 5,037,500 & 1,550 & 456,750 & 1,575 & 13,635,000 & 101,000 & 19,129,250 \\ \hline 23 & 8,531,250 & 2,625 & 353,220 & 1,218 & 11,016,000 & 81,600 & 19,900,470 \\ \hline 24 & 8,775,000 & 2,700 & 645,540 & 2,226 & 12,204,000 & 90,400 & 21,624,540 \\ \hline 25 & 7,637,500 & 2,350 & 852,600 & 2,940 & 11,610,000 & 86,000 & 20,100,100 \\ \hline 26 & 3,250,000 & 1,000 & 596,820 & 2,058 & 15,592,500 & 115,500 & 19,439,320 \\ \hline 27 & 6,857,500 & 2,110 & 718,620 & 2,478 & 12,507,750 & 92,650 & 20,083,870 \\ \hline 28 & 5,980,000 & 1,840 & 694,260 & 2,394 & 13,223,250 & 97,950 & 19,897,510 \\ \hline 29 & 7,410,000 & 2,280 & 444,570 & 1,533 & 12,285,000 & 91,000 & 20,139,570 \\ \hline 30 & 6,175,000 & 1,900 & 627,270 & 2,163 & 13,230,000 & 98,000 & 20,032,270 \\ \hline 31 & 3,331,250 & 1,025 & 572,460 & 1,974 & 16,470,000 & 122,000 & 20,373,710 \\ \hline 32 & 5,850,000 & 1,800 & 401,940 & 1,386 & 13,702,500 & 101,500 & 19,954,440 \\ \hline 33 & 7,312,500 & 2,250 & 706,440 & 2,436 & 12,420,000 & 92,000 & 20,438,940 \\ \hline 34 & 8937500 & 2750 & 971500 & 3350 & 11340 11 & 84000 & 21249000 \\ \hline \end{tabular} While collecting the first data set, Julie Jordan, the lead Cost Accountant for CTC, also collected some additional information over the 48 observations. Alfred Olson is Julie's direct supervisor. When Julie was a student at the University of Memphis, she studied activity-based costing in her cost accounting class. Like Alfred, she thought that only part of the conversion costs (labor-related costs such as wages, benefits, etc.) appeared to be related to direct labor hours. After further study, it appeared that some batch-related costs in the conversion costs were related to the number of setups, and another portion of conversion costs was related to the number of orders made to purchase direct materials for the tires. Data Set 2 provides additional information for the 48 observations collected by Julie. It includes information for setup costs, purchasing costs, labor-related costs, and total conversion costs. The total conversion costs are equal to the sum of setup costs, purchasing costs and laborrelated costs. Julie also provides you with the number of setups, the number of purchase orders, and direct labor hours used for products CTC/A105 and CTC/B107. Julie Jordan is concerned that the relationship between conversion costs and direct labor hours has weakened since automation, given the significant decrease in the required number of direct labor hours. At the same time, overhead costs resulting from the new automation has increased dramatically. Thus, Julie has asked you to compile some additional information for her next meeting with the CEO next week. \begin{tabular}{|c|c|c|c|c|c|c|c|} \hline 20 & 5,265,000 & 1,620 & 481,110 & 1,659 & 13,284,000 & 98,400 & 19,030,110 \\ \hline 21 & 3,250,000 & 1,000 & 846,510 & 2,919 & 15,120,000 & 112,000 & 19,216,510 \\ \hline 22 & 5,037,500 & 1,550 & 456,750 & 1,575 & 13,635,000 & 101,000 & 19,129,250 \\ \hline 23 & 8,531,250 & 2,625 & 353,220 & 1,218 & 11,016,000 & 81,600 & 19,900,470 \\ \hline 24 & 8,775,000 & 2,700 & 645,540 & 2,226 & 12,204,000 & 90,400 & 21,624,540 \\ \hline 25 & 7,637,500 & 2,350 & 852,600 & 2,940 & 11,610,000 & 86,000 & 20,100,100 \\ \hline 26 & 3,250,000 & 1,000 & 596,820 & 2,058 & 15,592,500 & 115,500 & 19,439,320 \\ \hline 27 & 6,857,500 & 2,110 & 718,620 & 2,478 & 12,507,750 & 92,650 & 20,083,870 \\ \hline 28 & 5,980,000 & 1,840 & 694,260 & 2,394 & 13,223,250 & 97,950 & 19,897,510 \\ \hline 29 & 7,410,000 & 2,280 & 444,570 & 1,533 & 12,285,000 & 91,000 & 20,139,570 \\ \hline 30 & 6,175,000 & 1,900 & 627,270 & 2,163 & 13,230,000 & 98,000 & 20,032,270 \\ \hline 31 & 3,331,250 & 1,025 & 572,460 & 1,974 & 16,470,000 & 122,000 & 20,373,710 \\ \hline 32 & 5,850,000 & 1,800 & 401,940 & 1,386 & 13,702,500 & 101,500 & 19,954,440 \\ \hline 33 & 7,312,500 & 2,250 & 706,440 & 2,436 & 12,420,000 & 92,000 & 20,438,940 \\ \hline 34 & 8,937,500 & 2,750 & 971,500 & 3,350 & 11,340,000 & 84,000 & 21,249,000 \\ \hline 35 & 3,575,000 & 1,100 & 645,250 & 2,225 & 15,660,000 & 116,000 & 19,880,250 \\ \hline 36 & 7,800,000 & 2,400 & 870,870 & 3,003 & 12,217,500 & 90,500 & 20,888,370 \\ \hline 37 & 3,900,000 & 1,200 & 334,950 & 1,155 & 13,263,750 & 98,250 & 17,498,700 \\ \hline 38 & 6,110,000 & 1,880 & 475,020 & 1,638 & 13,412,250 & 99,350 & 19,997,270 \\ \hline 39 & 4,290,000 & 1,320 & 828,240 & 2,856 & 14,094,000 & 104,400 & 19,212,240 \\ \hline 40 & 4,875,000 & 1,500 & 468,930 & 1,617 & 12,690,000 & 94,000 & 18,033,930 \\ \hline 41 & 4,306,250 & 1,325 & 590,730 & 2,037 & 13,601,250 & 100,750 & 18,498,230 \\ \hline 42 & 7,150,000 & 2,200 & 365,400 & 1,260 & 13,790,250 & 102,150 & 21,305,650 \\ \hline 43 & 6,175,000 & 1,900 & 487,200 & 1,680 & 10,800,000 & 80,000 & 17,462,200 \\ \hline 44 & 4,972,500 & 1,530 & 517,650 & 1,785 & 11,745,000 & 87,000 & 17,235,150 \\ \hline 45 & 3,347,500 & 1,030 & 761,250 & 2,625 & 13,027,500 & 96,500 & 17,136,250 \\ \hline 46 & 5,200,000 & 1,600 & 347,130 & 1,197 & 11,947,500 & 88,500 & 17,494,630 \\ \hline 47 & 2,925,000 & 900 & 730,800 & 2,520 & 16,065,000 & 119,000 & 19,720,800 \\ \hline 48 & 4,322,500 & 1,330 & 476,760 & 1,644 & 12,960,000 & 96,000 & 17,759,260 \\ \hline & Total Setup Costs & Total \# of Setups & Total Purchase CostsT & Total \# of Purchasing orders & Total Labor Costs & Total DLH & Total Costs \\ \hline & 259,983,750 & 79,995 & 27,532,600 & 94,940 & 636,714,000 & 4,716,400 & 924,230,350 \\ \hline & & & & & & & \\ \hline & & & & & & & \\ \hline \end{tabular}
 Step by Step Solution
There are 3 Steps involved in it
Step: 1

Get Instant Access to Expert-Tailored Solutions
See step-by-step solutions with expert insights and AI powered tools for academic success
Step: 2

Step: 3
Ace Your Homework with AI
Get the answers you need in no time with our AI-driven, step-by-step assistance
Get Started
The Safety Audit Designing Effective Strategies
Authors: Roger Saunders
1st Edition
0273034480, 978-0273034483