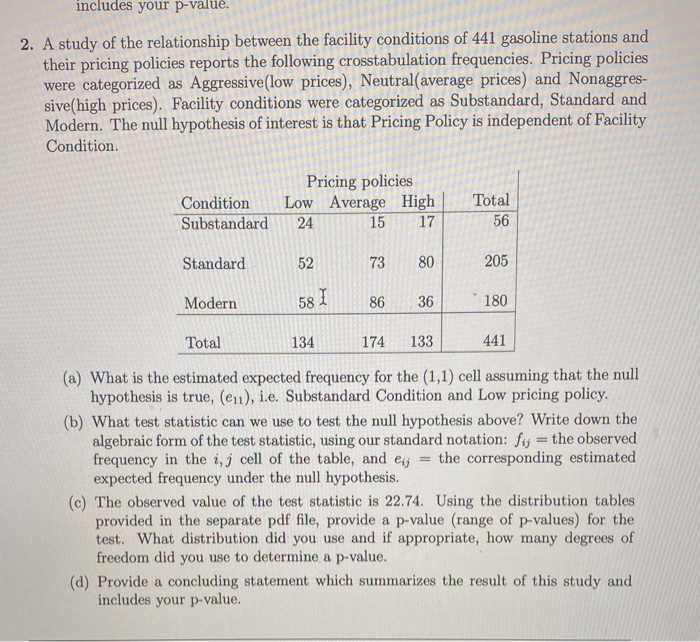
Includes your p-value. 2. A study of the relationship between the facility conditions of 441 gasoline stations and their pricing policies reports the following crosstabulation frequencies. Pricing policies were categorized as Aggressive(low prices), Neutral(average prices) and Nonaggres- sive(high prices). Facility conditions were categorized as Substandard, Standard and Modern. The null hypothesis of interest is that Pricing Policy is independent of Facility Condition. Condition Substandard Pricing policies Low Average High Total 24 15 1756 Standard 73 80 205 Modern 58 I 86 36 .180 Total 134 174 133 441 (a) What is the estimated expected frequency for the (1,1) cell assuming that the null hypothesis is true, (eu), i.e. Substandard Condition and Low pricing policy. (b) What test statistic can we use to test the null hypothesis above? Write down the algebraic form of the test statistic, using our standard notation: fi = the observed frequency in the i, j cell of the table, and ej = the corresponding estimated expected frequency under the null hypothesis. (c) The observed value of the test statistic is 22.74. Using the distribution tables provided in the separate pdf file, provide a p-value (range of p-values) for the test. What distribution did you use and if appropriate, how many degrees of freedom did you use to determine a p-value. (d) Provide a concluding statement which summarizes the result of this study and includes your p-value. Includes your p-value. 2. A study of the relationship between the facility conditions of 441 gasoline stations and their pricing policies reports the following crosstabulation frequencies. Pricing policies were categorized as Aggressive(low prices), Neutral(average prices) and Nonaggres- sive(high prices). Facility conditions were categorized as Substandard, Standard and Modern. The null hypothesis of interest is that Pricing Policy is independent of Facility Condition. Condition Substandard Pricing policies Low Average High Total 24 15 1756 Standard 73 80 205 Modern 58 I 86 36 .180 Total 134 174 133 441 (a) What is the estimated expected frequency for the (1,1) cell assuming that the null hypothesis is true, (eu), i.e. Substandard Condition and Low pricing policy. (b) What test statistic can we use to test the null hypothesis above? Write down the algebraic form of the test statistic, using our standard notation: fi = the observed frequency in the i, j cell of the table, and ej = the corresponding estimated expected frequency under the null hypothesis. (c) The observed value of the test statistic is 22.74. Using the distribution tables provided in the separate pdf file, provide a p-value (range of p-values) for the test. What distribution did you use and if appropriate, how many degrees of freedom did you use to determine a p-value. (d) Provide a concluding statement which summarizes the result of this study and includes your p-value