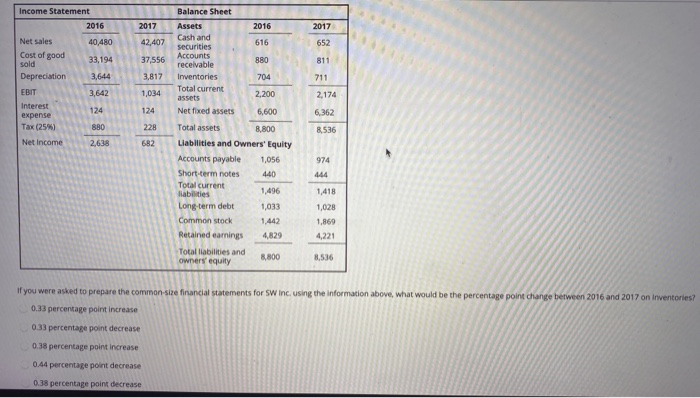
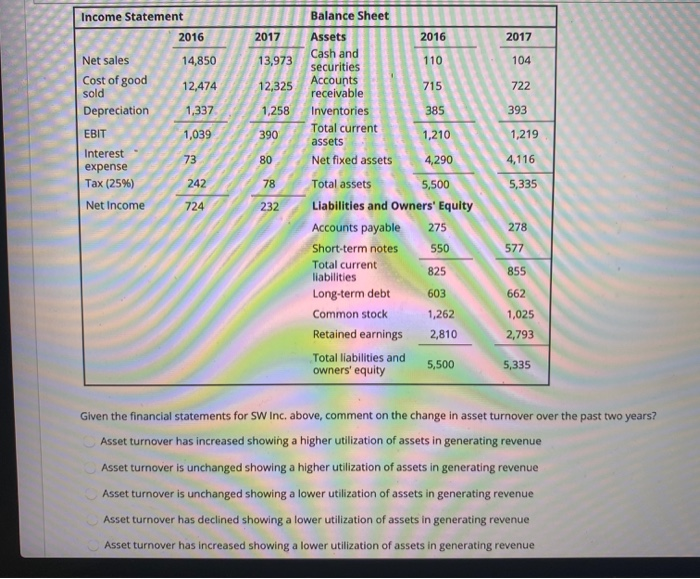
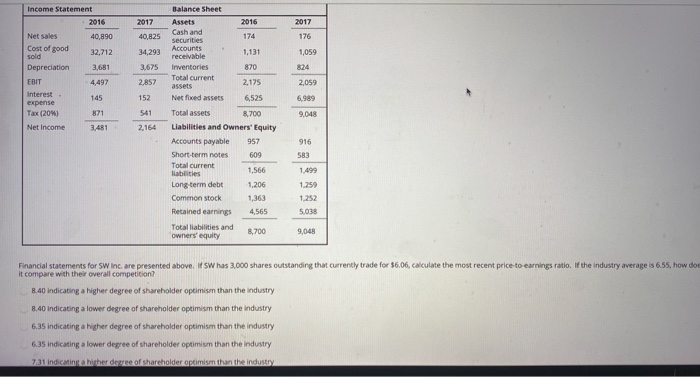
Income Statement 2016 2017 40,480 42,407 33,194 37,556 2012 3,644 Net sales Cost of good sold Depreciation EBIT Interest expense Tax (25) Net Income 3.642 1.034 228 682 Balance Sheet Assets Carch and 516 securities Accounts 880 receivable Inventories 704 Total current 3200 assets Net fixed assets 6,600 Total assets 8,800 Liabilities and Owners' Equity Accounts payable 1,056 Short-term notes 440 Total current 1,496 Mabilities Long-term debt 1,033 Common stock 1.442 Retained earnings 4829 Totes and owners equity 974 1,418 1,028 1,869 4.221 30 8536 If you were asked to prepare the common se financial statements for Swing using the information above, what would be the percentage point change between 2016 and 2017 on inventories 0.33 percentage point increase 0.33 percentage point decrease 0.38 percentage point increase 0.44 percentage point decrease 0.38 percentage point decrease Balance Sheet Assets 2016 2017 104 722 Sold Income Statement 2016 2017 Net sales 14,850 P 13,973 Cost of good 12,474 1 2,325 Depreciation 1,337 1,258 EBIT 39390 Interest 80 expense Tax (25%) Net Income securities Accounts receivable Inventories Total current assets Net fixed assets 393 210 To 1,219 4,290 4,116 5,500 5.335 275 278 Total assets Liabilities and Owners' Equity Accounts payable Short-term notes 550 Total current liabilities 825 Long-term debt 603 Common stock 1,262 Retained earnings 2,810 Total liabilities and owners' equity 5,500 855 662 1,025 2,793 5,335 Given the financial statements for SW Inc. above, comment on the change in asset turnover over the past two years? Asset turnover has increased showing a higher utilization of assets in generating revenue Asset turnover is unchanged showing a higher utilization of assets in generating revenue Asset turnover is unchanged showing a lower utilization of assets in generating revenue Asset turnover has declined showing a lower utilization of assets in generating revenue Asset turnover has increased showing a lower utilization of assets in generating revenue Income Statement Balance Sheet 2017 40,825 Assets Cash and securities 40,890 Net sales Cost of good 32,712 1,131 1,059 34,293 3.675 Depreciation 4,497 2,857 2,175 2,059 Inventories Total current assets Net fixed assets Total assets 6.525 Interest expense Tax (2041 541 8.700 Net Income 2,164 Liabilities and Owners' Equity 957 609 1,566 1,206 1.259 Accounts payable Short-term notes Total current liabilities Long-term debt Common stock Retained earnings Total liabilities and owners' equity 1.363 1252 5. 08 4,565 8.700 9048 Financial statements for SW Inc. are presented above. I SW has 3.000 shares outstanding that currently trade for $6.06, calculate the most recent price to earnings ratio. If the industry average is 6.55, how doe it compare with their overall competition? 8.40 indicating a higher degree of shareholder optimism than the industry 8.40 indicating a lower degree of shareholder optimism than the industry 6.35 indicating a higher degree of shareholder optimism than the industry 6.35 indicating a lower degree of shareholder optimism than the industry 731 indicating higher degree of shareholder optimism than the industry Income 1/1 - 12/31/2525 SW Inc. Tinancial statements Tor 2017 show Balance Sheet, 12/31/2525 $1850 Current assets 1190 Det 522600 POSE $3.100. Stockholders.cuity 54.450 Total assets net income $1095 r atio SW Inc. in an industry where the average net profit margin is 423the debto statement most consistent with the DuPont analysis Debe Totale and return on equity is 27.60%. For the company relative to the industry, select the one the company's asset turnover indicates sales are unusually small relative to its assets the company's profit margin indicates its revenues are unusually large relative to costs the company's equity multiplier indicates the firm has an unusually small debt burden the company's equity multiplier indicates the firm has an unusually large debt burden the company's asset turnover indicates sales are usually large relative to


