Answered step by step
Verified Expert Solution
Question
1 Approved Answer
INCOME STATEMENT 2018 2019 2020 Sales Sales Retun & Allowances Sales Discount Net Sales 29.500.000 -280.000 -820.000 28.400.000 34.800.000 -320.000 -880.000 33.600.000 39.100.000 -300.000 -900.000
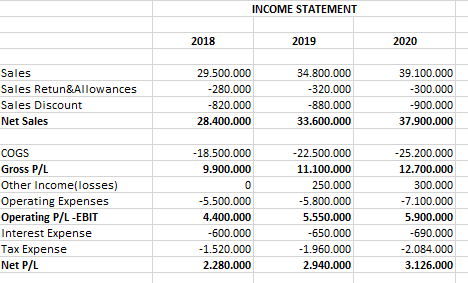
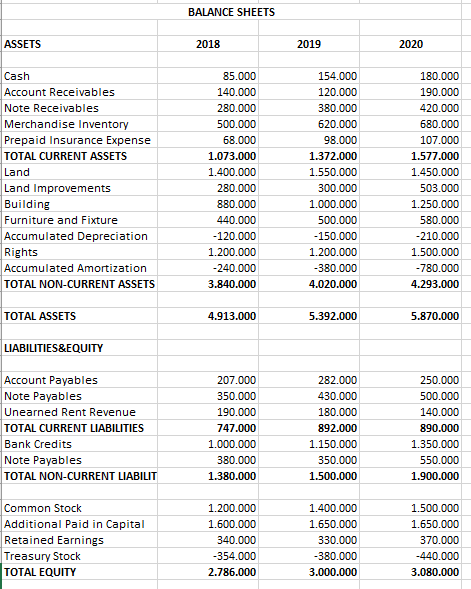
INCOME STATEMENT 2018 2019 2020 Sales Sales Retun & Allowances Sales Discount Net Sales 29.500.000 -280.000 -820.000 28.400.000 34.800.000 -320.000 -880.000 33.600.000 39.100.000 -300.000 -900.000 37.900.000 COGS Gross P/L Other Income(losses) Operating Expenses Operating P/L-EBIT Interest Expense Tax Expense Net P/L -18.500.000 9.900.000 0 -5.500.000 4.400.000 -600.000 -1.520.000 2.280.000 -22.500.000 11.100.000 250.000 -5.800.000 5.550.000 -650.000 -1.960.000 2.940.000 -25.200.000 12.700.000 300.000 -7.100.000 5.900.000 -690.000 -2.084.000 3.126.000 BALANCE SHEETS ASSETS 2018 2019 2020 Cash Account Receivables Note Receivables Merchandise Inventory Prepaid Insurance Expense TOTAL CURRENT ASSETS Land Land Improvements Building Furniture and Fixture Accumulated Depreciation Rights Accumulated Amortization TOTAL NON-CURRENT ASSETS 85.000 140.000 280.000 500.000 68.000 1.073.000 1.400.000 280.000 880.000 440.000 - 120.000 1.200.000 -240.000 3.840.000 154.000 120.000 380.000 620.000 98.000 1.372.000 1.550.000 300.000 1.000.000 500.000 - 150.000 1.200.000 -380.000 4.020.000 180.000 190.000 420.000 680.000 107.000 1.577.000 1.450.000 503.000 1.250.000 580.000 -210.000 1.500.000 -780.000 4.293.000 TOTAL ASSETS 4.913.000 5.392.000 5.870.000 LIABILITIES&EQUITY Account Payables Note Payables Unearned Rent Revenue TOTAL CURRENT LIABILITIES Bank Credits Note Payables TOTAL NON-CURRENT LIABILIT 207.000 350.000 190.000 747.000 1.000.000 380.000 1.380.000 282.000 430.000 180.000 892.000 1.150.000 350.000 1.500.000 250.000 500.000 140.000 890.000 1.350.000 550.000 1.900.000 Common Stock Additional Paid in Capital Retained Earnings Treasury Stock TOTAL EQUITY 1.200.000 1.600.000 340.000 -354.000 2.786.000 1.400.000 1.650.000 330.000 -380.000 3.000.000 1.500.000 1.650.000 370.000 -440.000 3.080.000 ADDITIONAL INFORMATION: Outstanding Shares Depreciation Expenses Amortization Expense Market Price per Share 2018 1.100.000 113.000 240.000 18 2019 1.200.000 122.000 290.000 21 2020 1.300.000 128.000 280.000 22 Perform Common-Size Analyis for the Years 2019 and 2020
Step by Step Solution
There are 3 Steps involved in it
Step: 1
Get Instant Access to Expert-Tailored Solutions
See step-by-step solutions with expert insights and AI powered tools for academic success
Step: 2
Step: 3
Ace Your Homework with AI
Get the answers you need in no time with our AI-driven, step-by-step assistance
Get Started