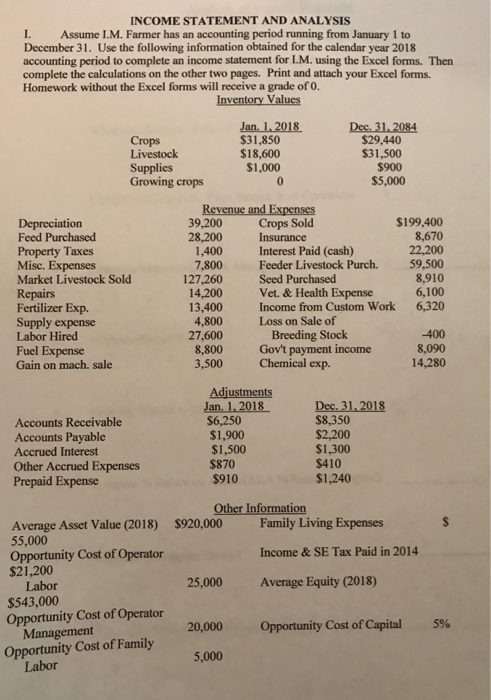
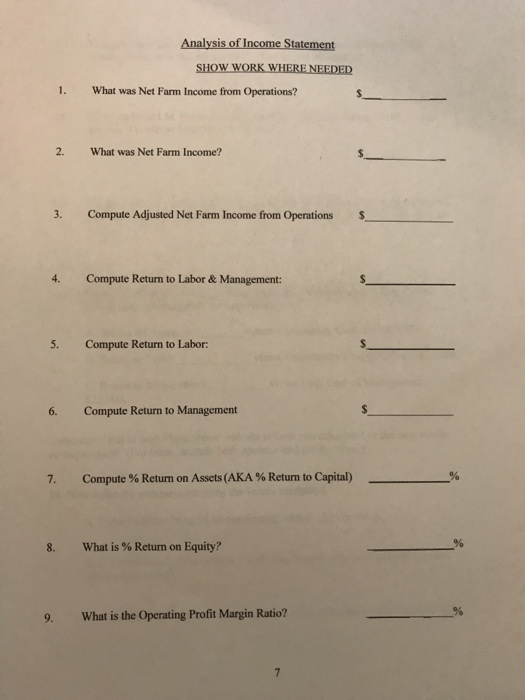
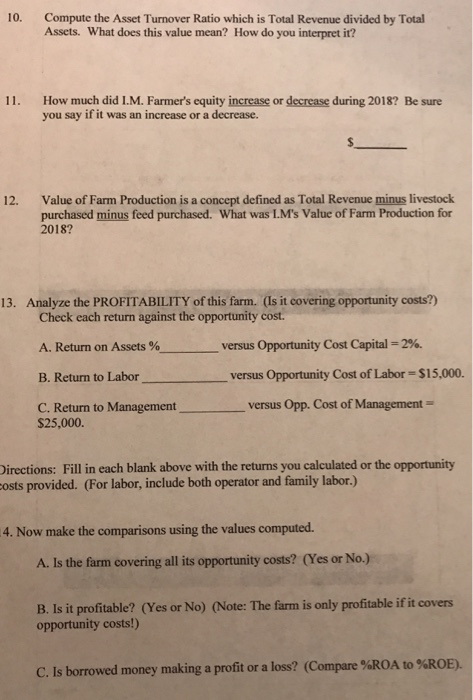
INCOME STATEMENT AND ANALYSIS I. Assume I.M. Farmer has an accounting period running from January 1 to December 31. Use the following information obtained for the calendar year 2018 accounting period to complete an income statement for LM. using the Excel forms. Then complete the calculations on the other two pages. Print and attach your Excel forms. Homework without the Excel forms will receive a grade of 0. Inventory Values $31,850 $18,600 $1,000 $29,440 $31,500 $900 5,000 Crops Supplies Growing crops 39,200 28,200 1,400 7,800 127,260 14,200 Crops Sold Insurance Interest Paid (cash) Feeder Livestock Purch. Seed Purchased Vet. & Health Expense Income from Custom Work Loss on Sale of $199,400 8,670 22,200 59,500 8,910 6,100 6,320 ion Feed Purchased Property Taxes Misc. Expenses Market Livestock Sold Repairs Fertilizer Exp. Supply expense Labor Hired Fuel Expense Gain on mach. sale 27,600 8,800 3,500 Breeding Stock Gov't payment income Chemical exp. -400 8,090 14,280 Accounts Receivable Accounts Payable Accrued Interest Other Accrued Expenses Prepaid Expense $1,900 $1,500 $870 $910 $8,350 $2,200 $1,300 $410 $1,240 Other Information Average Asset Value (2018) 55,000 Opportunity Cost of Operator $21,200 Family Living Expenses Income & SE Tax Paid in 2014 Average Equity (2018) $920,000 25,000 Labor $543,000 Opportunity Cost of Operator 5% ManagenClost of Family 5,000 20,000 Opportunity Cost ofcapital Opportunity Cost of Family Analysis of Income Statement SHOW WORK WHERE NEEDED 1. What was Net Farm Income from Operations? 2. What was Net Farm Income? 3. Compute Adjusted Net Farm Income from Operations $ 4. Compute Return to Labor &Management: 5. Compute Return to Labor: 6. Compute Return to Management Compute % Return on Assets (AKA % Return to Capital) 8, what is % Return on Equity? 9. What is the Operating Profit Margin Ratio? 10. Compute the Asset Turnover Ratio which is Total Revenue divided by Total Assets. What does this value mean? How do you interpret it? How much did I.M. Farmers equity increase or decrease during 2018? Be sure you say if it was an increase or a decrease. 11. 12. Value of Farm Production is a concept defined as Total Revenue minus livestock purchased minus feed purchased. What was I.M's Value of Farm Production for 2018? 13. Analyze the PROFITABILITY of this farm. (ls it covering opportunity costs?) Check each return against the opportunity cost A. Return on Assets versus Opportunity Cost Capital-2 B. Return to Labor C. Return to Management versus Opp. Cost of Management versus Opportunity Cost of Labor S15,000. $25,000. irections: Fill in each blank above with the returns you calculated or the opportunity osts provided. (For labor, include both operator and family labor.) 4. Now make the comparisons using the values computed A. Is the farm covering all its opportunity costs? (Yes or No.) B. Is it profitable? (Yes or No) (Note: The farm is only profitable if it covers opportunity costs!) C. Is borrowed money making a profit or a loss? (Compare %ROA to %ROE). INCOME STATEMENT AND ANALYSIS I. Assume I.M. Farmer has an accounting period running from January 1 to December 31. Use the following information obtained for the calendar year 2018 accounting period to complete an income statement for LM. using the Excel forms. Then complete the calculations on the other two pages. Print and attach your Excel forms. Homework without the Excel forms will receive a grade of 0. Inventory Values $31,850 $18,600 $1,000 $29,440 $31,500 $900 5,000 Crops Supplies Growing crops 39,200 28,200 1,400 7,800 127,260 14,200 Crops Sold Insurance Interest Paid (cash) Feeder Livestock Purch. Seed Purchased Vet. & Health Expense Income from Custom Work Loss on Sale of $199,400 8,670 22,200 59,500 8,910 6,100 6,320 ion Feed Purchased Property Taxes Misc. Expenses Market Livestock Sold Repairs Fertilizer Exp. Supply expense Labor Hired Fuel Expense Gain on mach. sale 27,600 8,800 3,500 Breeding Stock Gov't payment income Chemical exp. -400 8,090 14,280 Accounts Receivable Accounts Payable Accrued Interest Other Accrued Expenses Prepaid Expense $1,900 $1,500 $870 $910 $8,350 $2,200 $1,300 $410 $1,240 Other Information Average Asset Value (2018) 55,000 Opportunity Cost of Operator $21,200 Family Living Expenses Income & SE Tax Paid in 2014 Average Equity (2018) $920,000 25,000 Labor $543,000 Opportunity Cost of Operator 5% ManagenClost of Family 5,000 20,000 Opportunity Cost ofcapital Opportunity Cost of Family Analysis of Income Statement SHOW WORK WHERE NEEDED 1. What was Net Farm Income from Operations? 2. What was Net Farm Income? 3. Compute Adjusted Net Farm Income from Operations $ 4. Compute Return to Labor &Management: 5. Compute Return to Labor: 6. Compute Return to Management Compute % Return on Assets (AKA % Return to Capital) 8, what is % Return on Equity? 9. What is the Operating Profit Margin Ratio? 10. Compute the Asset Turnover Ratio which is Total Revenue divided by Total Assets. What does this value mean? How do you interpret it? How much did I.M. Farmers equity increase or decrease during 2018? Be sure you say if it was an increase or a decrease. 11. 12. Value of Farm Production is a concept defined as Total Revenue minus livestock purchased minus feed purchased. What was I.M's Value of Farm Production for 2018? 13. Analyze the PROFITABILITY of this farm. (ls it covering opportunity costs?) Check each return against the opportunity cost A. Return on Assets versus Opportunity Cost Capital-2 B. Return to Labor C. Return to Management versus Opp. Cost of Management versus Opportunity Cost of Labor S15,000. $25,000. irections: Fill in each blank above with the returns you calculated or the opportunity osts provided. (For labor, include both operator and family labor.) 4. Now make the comparisons using the values computed A. Is the farm covering all its opportunity costs? (Yes or No.) B. Is it profitable? (Yes or No) (Note: The farm is only profitable if it covers opportunity costs!) C. Is borrowed money making a profit or a loss? (Compare %ROA to %ROE)


