

Answered step by step
Verified Expert Solution
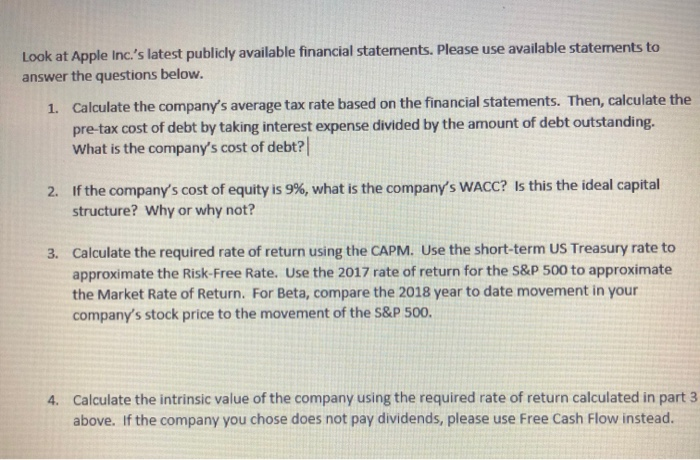
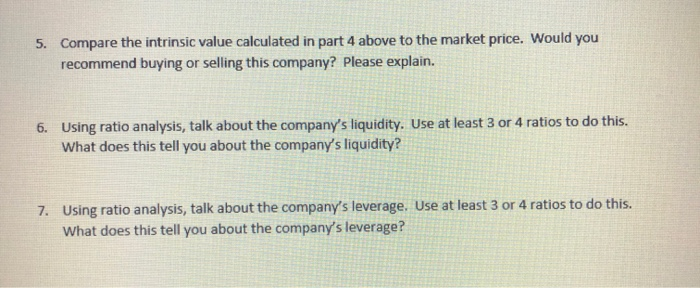
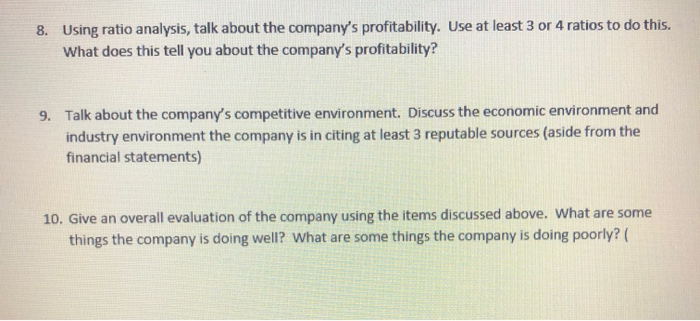
Question
1 Approved Answer
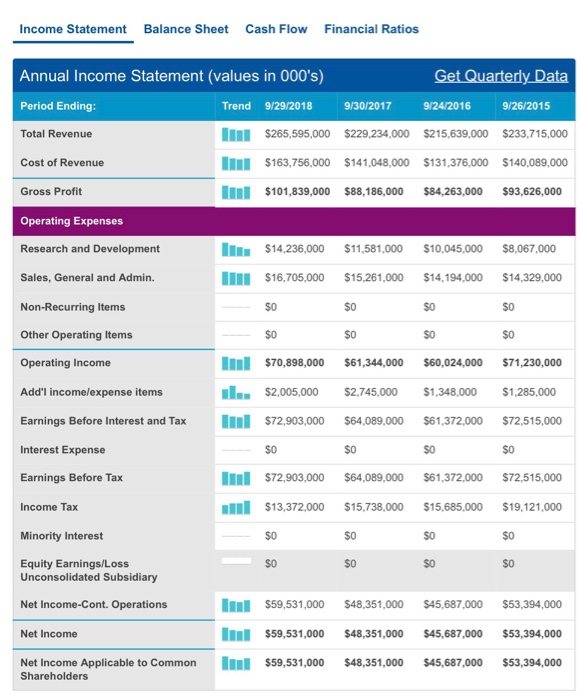
Income Statement Balance Sheet Cash Flow Financial Ratios Annual Income Statement (values in 000's) Period Ending Total Revenue Trend 9/29/2018 9/30/2017 9/24/2016 9/26/2015 $265,595,000 $229234,000
Step by Step Solution
There are 3 Steps involved in it
Step: 1

Get Instant Access to Expert-Tailored Solutions
See step-by-step solutions with expert insights and AI powered tools for academic success
Step: 2

Step: 3
Ace Your Homework with AI
Get the answers you need in no time with our AI-driven, step-by-step assistance
Get Started
Quantitative Analysis For Management
Authors: Barry Render, Ralph M. Stair, Michael E. Hanna, Trevor S. Hale
14th Edition
0137943601, 9780137943609