

Answered step by step
Verified Expert Solution
Question
1 Approved Answer
Walmart's Ratio Analysis Required: Comment on the Walmart's 3-year trends in the following liquidity, solvency, and profitability ratios: Return on Assets. Is it up
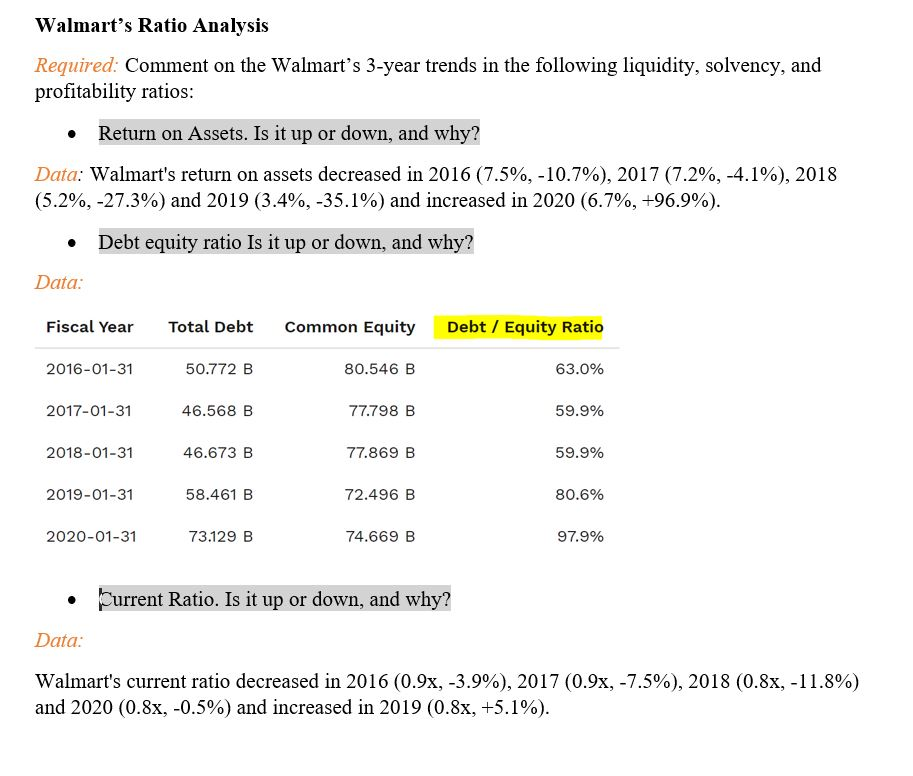
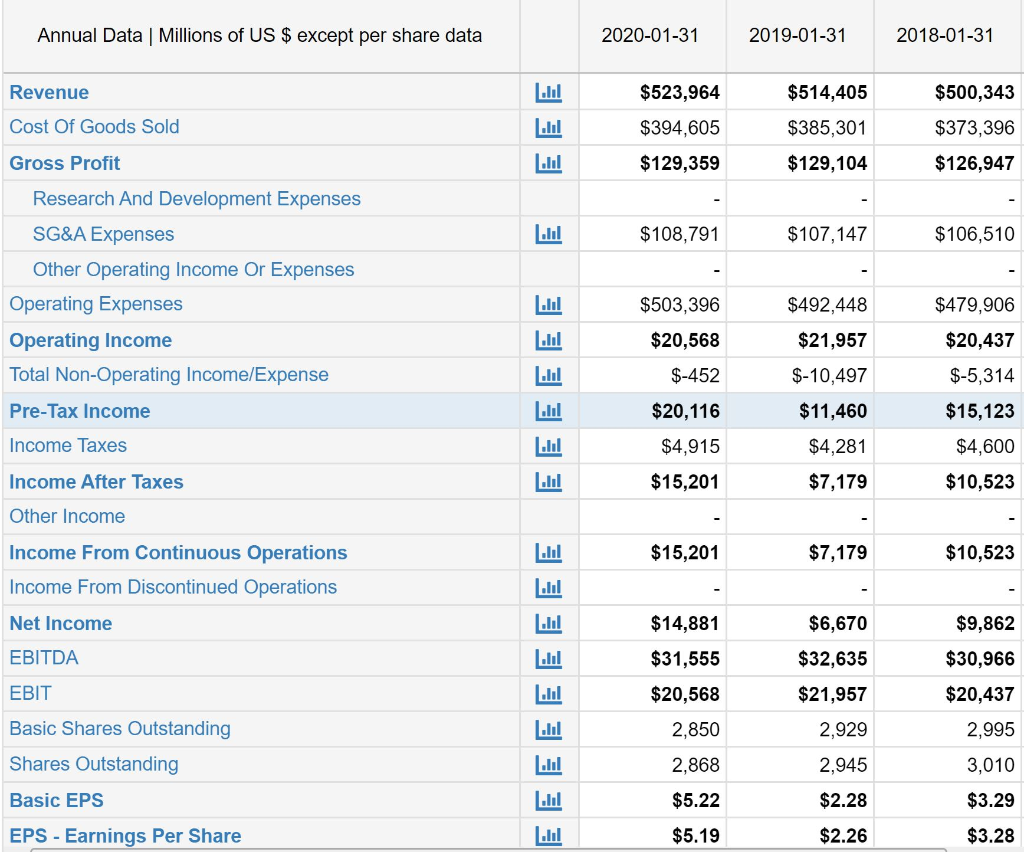
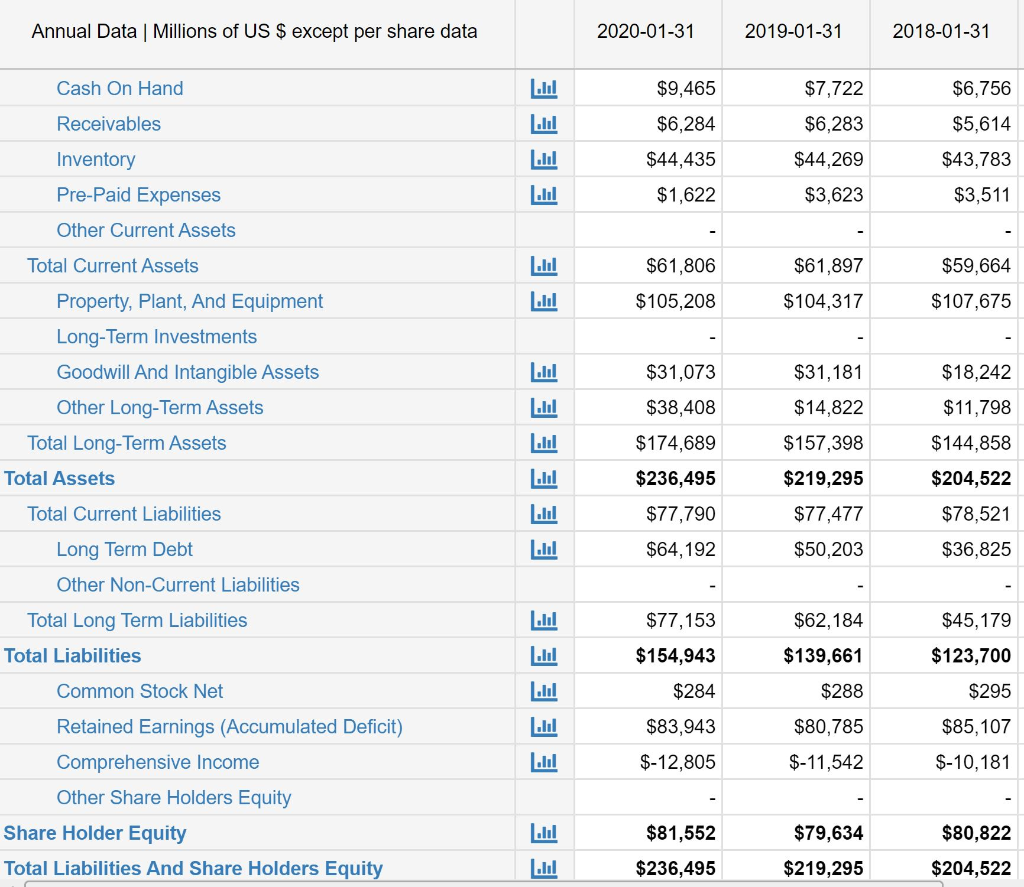
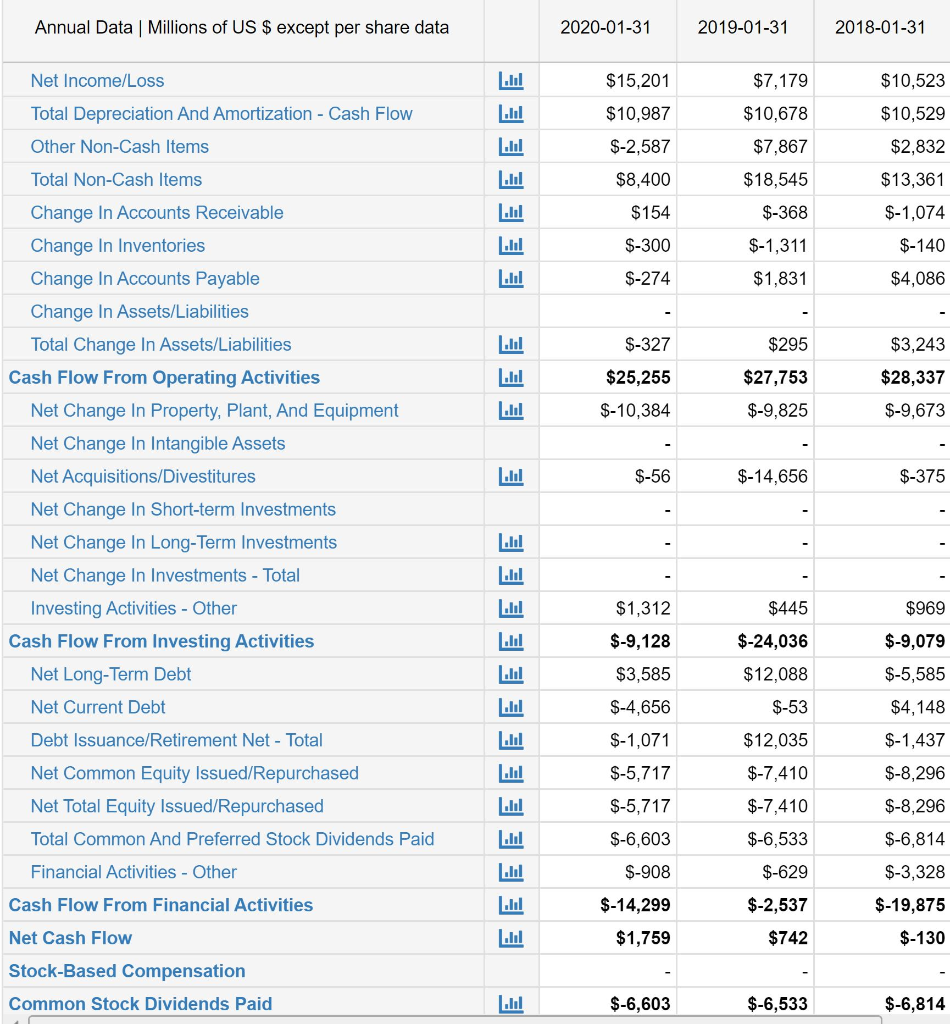
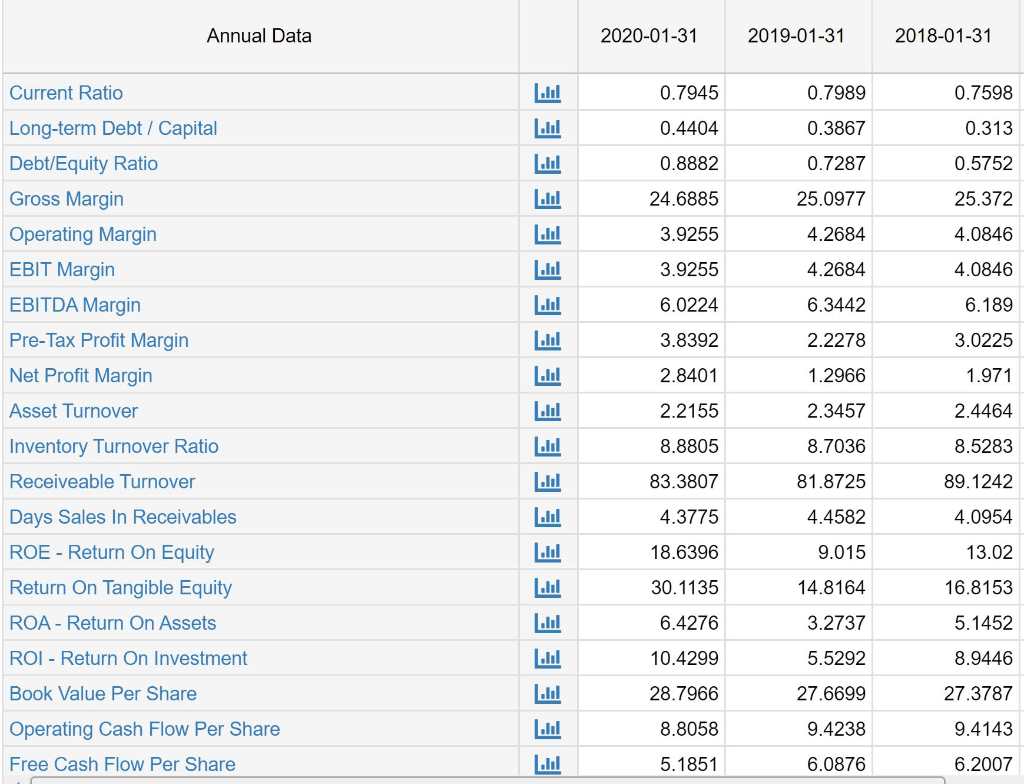
Walmart's Ratio Analysis Required: Comment on the Walmart's 3-year trends in the following liquidity, solvency, and profitability ratios: Return on Assets. Is it up or down, and why? Data: Walmart's return on assets decreased in 2016 (7.5%, -10.7%), 2017 (7.2%, -4.1%), 2018 (5.2%, -27.3%) and 2019 (3.4%, -35.1%) and increased in 2020 (6.7%, +96.9%). Debt equity ratio Is it up or down, and why? Data: Fiscal Year 2016-01-31 2017-01-31 2018-01-31 2019-01-31 2020-01-31 Total Debt 50.772 B 46.568 B 46.673 B 58.461 B 73.129 B Common Equity 80.546 B 77.798 B 77.869 B 72.496 B 74.669 B Debt / Equity Ratio Current Ratio. Is it up or down, and why? Data: 63.0% 59.9% 59.9% 80.6% 97.9% Walmart's current ratio decreased in 2016 (0.9x, -3.9%), 2017 (0.9x, -7.5%), 2018 (0.8x, -11.8%) and 2020 (0.8x, -0.5%) and increased in 2019 (0.8x, +5.1%). Annual Data | Millions of US $ except per share data Revenue Cost Of Goods Sold Gross Profit Research And Development Expenses SG&A Expenses Other Operating Income Or Expenses Operating Expenses Operating Income Total Non-Operating Income/Expense Pre-Tax Income Income Taxes Income After Taxes Other Income Income From Continuous Operations Income From Discontinued Operations Net Income EBITDA EBIT Basic Shares Outstanding Shares Outstanding Basic EPS EPS - Earnings Per Share EEE 3 Lul EEEEEE EEE ..... EEEEE 2020-01-31 $523,964 $394,605 $129,359 $108,791 $503,396 $20,568 $-452 $20,116 $4,915 $15,201 $15,201 $14,881 $31,555 $20,568 2,850 2,868 $5.22 $5.19 2019-01-31 $514,405 $385,301 $129,104 $107,147 $492,448 $21,957 $-10,497 $11,460 $4,281 $7,179 $7,179 $6,670 $32,635 $21,957 2,929 2,945 $2.28 $2.26 2018-01-31 $500,343 $373,396 $126,947 $106,510 $479,906 $20,437 $-5,314 $15,123 $4,600 $10,523 - $10,523 $9,862 $30,966 $20,437 2,995 3,010 $3.29 $3.28 Annual Data | Millions of US $ except per share data Cash On Hand Receivables Inventory Pre-Paid Expenses Other Current Assets Total Current Assets Property, Plant, And Equipment Long-Term Investments Goodwill And Intangible Assets Other Long-Term Assets Total Long-Term Assets Total Assets Total Current Liabilities Long Term Debt Other Non-Current Liabilities Total Long Term Liabilities Total Liabilities Common Stock Net Retained Earnings (Accumulated Deficit) Comprehensive Income Other Share Holders Equity Share Holder Equity Total Liabilities And Share Holders Equity EEEE EE EEEEEE 3 3 3 3 3 EE 2020-01-31 $9,465 $6,284 $44,435 $1,622 $61,806 $105,208 $31,073 $38,408 $174,689 $236,495 $77,790 $64,192 $77,153 $154,943 $284 $83,943 $-12,805 $81,552 $236,495 2019-01-31 $7,722 $6,283 $44,269 $3,623 $61,897 $104,317 $31,181 $14,822 $157,398 $219,295 $77,477 $50,203 $62,184 $139,661 $288 $80,785 $-11,542 $79,634 $219,295 2018-01-31 $6,756 $5,614 $43,783 $3,511 $59,664 $107,675 $18,242 $11,798 $144,858 $204,522 $78,521 $36,825 $45,179 $123,700 $295 $85,107 $-10,181 $80,822 $204,522 Annual Data | Millions of US $ except per share data Net Income/Loss Total Depreciation And Amortization - Cash Flow Other Non-Cash Items Total Non-Cash Items Change In Accounts Receivable Change In Inventories Change In Accounts Payable Change In Assets/Liabilities Total Change In Assets/Liabilities Cash Flow From Operating Activities Net Change In Property, Plant, And Equipment Net Change In Intangible Assets Net Acquisitions/Divestitures Net Change In Short-term Investments Net Change In Long-Term Investments Net Change In Investments - Total Investing Activities - Other Cash Flow From Investing Activities Net Long-Term Debt Net Current Debt Debt Issuance/Retirement Net - Total Net Common Equity Issued/Repurchased Net Total Equity Issued/Repurchased Total Common And Preferred Stock Dividends Paid Financial Activities - Other Cash Flow From Financial Activities Net Cash Flow Stock-Based Compensation Common Stock Dividends Paid EEEEEEE EEE E EEEEE L.M ... E 2020-01-31 $15,201 $10,987 $-2,587 $8,400 $154 $-300 $-274 $-327 $25,255 $-10,384 $-56 $1,312 $-9,128 $3,585 $-4,656 $-1,071 $-5,717 $-5,717 $-6,603 $-908 $-14,299 $1,759 $-6,603 2019-01-31 $7,179 $10,678 $7,867 $18,545 $-368 $-1,311 $1,831 $295 $27,753 $-9,825 $-14,656 $445 $-24,036 $12,088 $-53 $12,035 $-7,410 $-7,410 $-6,533 $-629 $-2,537 $742 $-6,533 2018-01-31 $10,523 $10,529 $2,832 $13,361 $-1,074 $-140 $4,086 $3,243 $28,337 $-9,673 $-375 $969 $-9,079 $-5,585 $4,148 $-1,437 $-8,296 $-8,296 $-6,814 $-3,328 $-19,875 $-130 $-6,814 Annual Data Current Ratio Long-term Debt / Capital Debt/Equity Ratio Gross Margin Operating Margin EBIT Margin EBITDA Margin Pre-Tax Profit Margin Net Profit Margin Asset Turnover Inventory Turnover Ratio Receiveable Turnover Days Sales In Receivables ROE - Return On Equity Return On Tangible Equity ROA - Return On Assets ROI - Return On Investment Book Value Per Share Operating Cash Flow Per Share Free Cash Flow Per Share EEEEEE 1.bl ..... Lul .... L.h .... ..... EEE 2020-01-31 0.7945 0.4404 0.8882 24.6885 3.9255 3.9255 6.0224 3.8392 2.8401 2.2155 8.8805 83.3807 4.3775 18.6396 30.1135 6.4276 10.4299 28.7966 8.8058 5.1851 2019-01-31 0.7989 0.3867 0.7287 25.0977 4.2684 4.2684 6.3442 2.2278 1.2966 2.3457 8.7036 81.8725 4.4582 9.015 14.8164 3.2737 5.5292 27.6699 9.4238 6.0876 2018-01-31 0.7598 0.313 0.5752 25.372 4.0846 4.0846 6.189 3.0225 1.971 2.4464 8.5283 89.1242 4.0954 13.02 16.8153 5.1452 8.9446 27.3787 9.4143 6.2007
Step by Step Solution
★★★★★
3.37 Rating (169 Votes )
There are 3 Steps involved in it
Step: 1
ANSWER Walmarts return on assets ROA decreased from 75 in 2016 to 34 in 2019 before increasing to 67 ...
Get Instant Access to Expert-Tailored Solutions
See step-by-step solutions with expert insights and AI powered tools for academic success
Step: 2

Step: 3
Ace Your Homework with AI
Get the answers you need in no time with our AI-driven, step-by-step assistance
Get Started
Corporate Financial Accounting
Authors: Carl S. Warren, James M. Reeve, Jonathan Duchac
15th Edition
978-1337398169