Answered step by step
Verified Expert Solution
Question
1 Approved Answer
INCOME STATEMENT (Figures in 5 millions) Net sales Cost of goods sold Other expenses Depreciation Earnings before interest and taxes (EBIT) Interest expense Income before
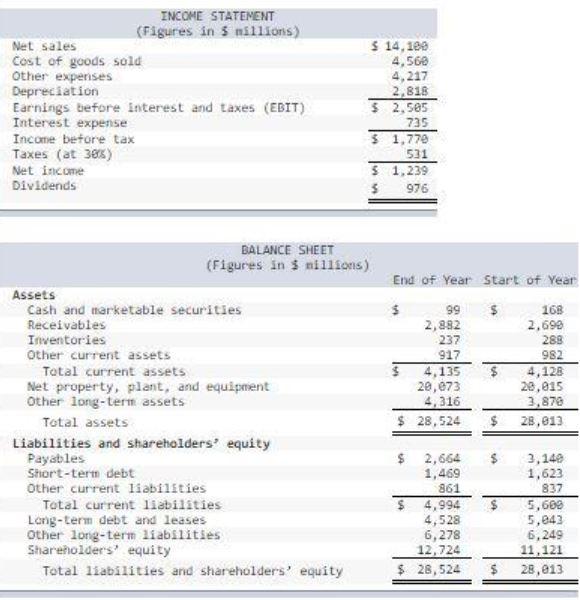
INCOME STATEMENT (Figures in 5 millions) Net sales Cost of goods sold Other expenses Depreciation Earnings before interest and taxes (EBIT) Interest expense Income before tax Taxes (at 385) Net income Dividends $ 14, 180 4,560 4,217 2.818 $ 2,585 735 3 1.770 531 3 1.239 $ 976 End of Year Start of Year $ BALANCE SHEET (Figures in 5 millions), Assets Cash and marketable securities Receivables Inventories Other current assets Total current assets Net property, plant, and equipment Other long-term assets Total assets Liabilities and shareholders' equity Payables Short-term debt Other current liabilities Total current liabilities Long-term debt and leases other long-term liabilities Shareholders' equity Total liabilities and shareholders' equity 99 2,882 237 917 4,135 20,673 4,316 $ 28,524 168 2,690 283 982 4,128 28,015 3,878 28.813 $ $ 2,664 1,469 861 $ 4,994 4,528 6,278 12,724 $ 28,524 3, 140 1,623 837 5,600 5,043 6,249 11, 121 28,013 $ i. Total debt ratio (use end-of-year balance sheet figures) 1. Times interest earned k. Cash coverage ratio 1. Current ratio (use end-of-year balance sheet figures) m. Quick ratio (use end-of-year balance sheet figures
Step by Step Solution
There are 3 Steps involved in it
Step: 1
Get Instant Access to Expert-Tailored Solutions
See step-by-step solutions with expert insights and AI powered tools for academic success
Step: 2
Step: 3
Ace Your Homework with AI
Get the answers you need in no time with our AI-driven, step-by-step assistance
Get Started