

Answered step by step
Verified Expert Solution
Question
1 Approved Answer
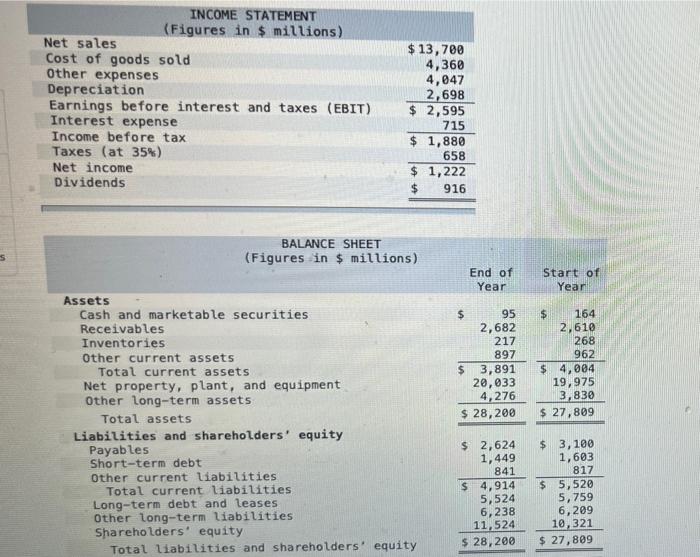
INCOME STATEMENT (Figures in $ millions) Net sales Cost of goods sold Other expenses Depreciation Earnings before interest and taxes (EBIT) Interest expense Income before
Step by Step Solution
There are 3 Steps involved in it
Step: 1

Get Instant Access to Expert-Tailored Solutions
See step-by-step solutions with expert insights and AI powered tools for academic success
Step: 2

Step: 3
Ace Your Homework with AI
Get the answers you need in no time with our AI-driven, step-by-step assistance
Get Started
The Structural Foundations Of Monetary Policy
Authors: Michael D. Bordo, John H. Cochrane, Amit Seru
1st Edition
0817921346, 978-0817921347