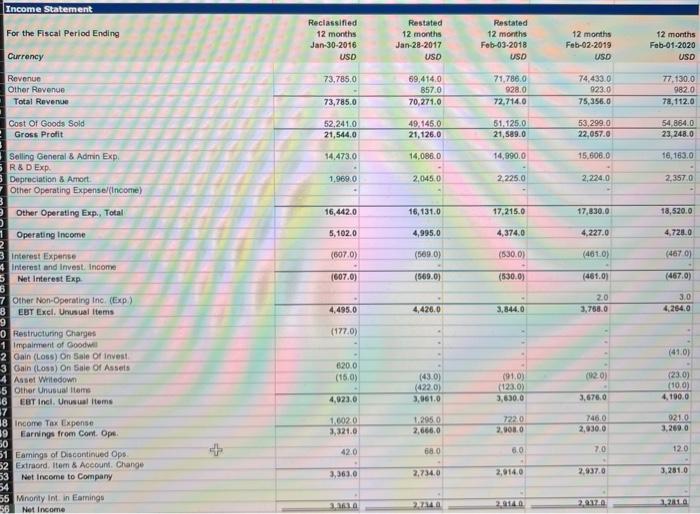
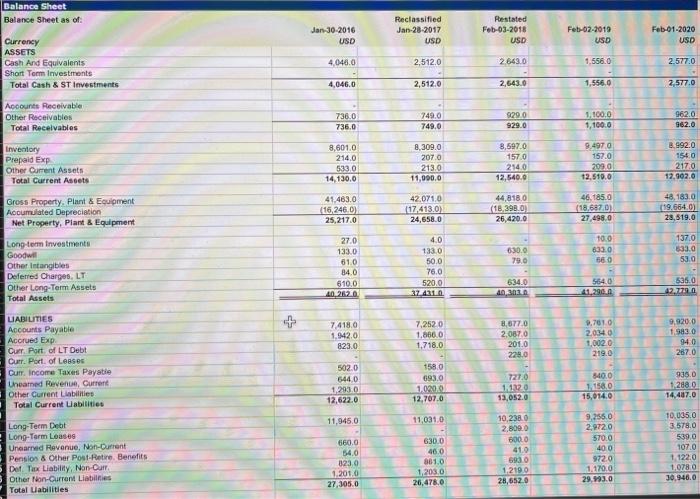
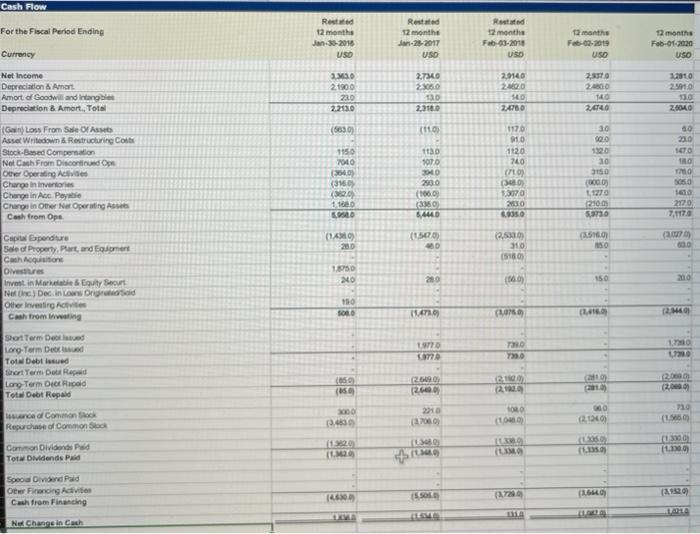
Income Statement For the Fiscal Period Ending Reclassified 12 months Jan-30-2016 USD Restated 12 months Jan-28-2017 USD Rastated 12 months Feb-03-2018 USD 12 months Feb-02-2019 USD 12 months Feb-01-2020 USD Currency 73,785,0 Revenue Other Revenue Total Revenue 69,414,0 857.0 70,271.0 71,788.0 928.0 72,714.0 74,433.0 923.0 75,355.0 77,130.0 982.0 78, 112.0 73,785.0 Cost Of Goods Sold Gross Profit 52.241.0 21,544.0 49,145.0 21,126.0 51.125.0 21,589.0 53,299.0 22.057.0 54 864.0 23, 248.0 14,473.0 14,086.0 14,990.0 15.800.0 16,163.0 Selling General & Admin Exp R&D Exp Depreciation & Amort Other Operating Expense/Income) 1,969.0 2.045.0 2.225.0 2,224.0 2,357.0 Other Operating Exp., Total 16,442.0 16,131.0 17,215.0 17,830.0 18,520.0 Operating Income 5,102.0 4,995.0 4,374.0 4.227.0 4.728.0 (5070) (569.0) (530.0) (4610) (4670) (607.0) (569.0) (530.0) (461.0) (467.0) 20 3,758.0 3.0 4,264,0 4,495.0 4,426.0 3,844.0 (1770) - (410) - 620.0 (150) (920) 3 Interest Expense 4 Interest and Invest income Net Interest Exp 3 7 Other Non-Operating Inc (Exp) 8 EBT Excl. Unusual Items 9 0 Restructuring Charges 1 Impairment of Good 2 Gain (Loss) On Sale Of invest 3 Gain (Loss) On Sale Of Assets 4 Asset Whitedown -5 Other Unusual items 6 EBT Incl. Unusual items 17 18 Income Tax Expense 9 Earnings from Cont. Op 50 51 Earnings of Discontinued Opp 52 Extraord, Item & Account Change 53 Net Income to Company 54 55 Monty Int in Eamingo 56 Net Income (430) (4220) 3.961.0 (910) (123.0) 3,630.0 (23.0 (100) 4.100.0 4,923.0 3,6760 1.0020 3,321.0 1.295 0 2,665,0 72220 2,9080 746.0 2.300 9210 3.269.0 + 68.0 60 70 12.0 420 - 3,3630 2,9140 2.734.0 2,937.0 3.281.0 10 2010 2.917.0 121 Balance Sheet Balance Sheet as of: Jan 30 2016 USD Reclassified Jan-28-2017 USD Restated Feb-03-2018 USD Feb-02-2019 USD Feb-01-2020 USD Currency ASSETS Cash And Equivalents Short Term Investments Total Cash & ST Investments 4,046.0 2,512.0 2.643.0 1.556.0 2.577.0 4,046,0 2,512.0 2,643.0 1,556.0 2,577.0 Accounts Receivable Other Receivables Total Receivables 736.0 736.0 749.0 749.0 929.0 929.0 1,100.0 1,100.0 962.0 562.0 Inventory Prepaid Exp Other Current Assets Total Current Assets 8,601,0 214.0 5330 14,130.0 8.309.0 2070 213.0 11,090.0 8,597.0 1570 214.0 12,540.0 9.4970 157.0 2030 12,510.0 8.992.0 1540 217.0 12.902.0 Gross Property. Plant & Equipment Accumulated Depreciation Net Property, Plant & Equipment 41.463.0 (16,246.0) 25,217.0 42.071.0 (17,413.0) 24,658.0 44,818.0 (18,398.00 26,420.0 46. 185.0 (18,6870) 27.498.0 48.183.0 (19.664.0 28,319.0 630.0 79.0 100 633.0 66 137.0 533.0 53.0 Long-term Investments Goodwil Other Intangibles Deferred Charges, LT Other Long-Term Assets Total Assets 27.0 133.0 61.0 84.0 610.0 40.2620 40 133.0 50.0 76.0 520.0 37.41 634.0 40,301 564.0 41.290.0 535.0 42.779 0 7.418.0 1.942.0 823.0 7.2520 1.866.0 1.718.0 8,877.0 2,0870 2010 228.0 9.7010 2.0340 1,0020 219.0 9,9200 1.9830 94.0 287.0 UABUTES Accounts Payable Accrued Exp Curr. Port of LT Debt Curr. Port of Losses Curr. Income Taxes Payable Uneamed Revenue, Current Other Current Liabilities Total Current Ulabilities 502.0 544.0 1.293.0 12,622.0 158.0 693.0 1.020 12,707.0 721.0 1.1120 13,0520 840.0 1158.0 15,014.0 936.0 1.2880 14,487.0 11,945.0 11,0310 Long-Term Debt Long-Term Louses Uneared Revenue, Non-Current Pensios & Other Post Retire. Benefits Def Tax Liability. Non Our Other Non-Ourrent Liabiles Total Liabilities 660.0 54.0 0230 12010 27,305.0 6300 400 861.0 1.203.0 26,478.0 10,238.0 2.8090 8000 410 6930 1,219,0 28,6520 9.255.0 2,9720 570.0 400 9720 1.170.0 29.993.0 10.035.0 3.578.0 5390 107.0 1 1220 1,0780 30,440.0 + 50.0 5,3480 3.1880 40.0 5,6610 5.8840 45.0 5.858 0 5.495.0 420 5,2250 6,0420 0.0170 Common Stock Additional Paid in Capital Related Eamingo Treasury Stock Comprehensive inc. and Othe Total Common Equity (629.0) 12,957.0 16380) 10,953.0 7470) 11.651,0 BOSO 11,297 0 (860) 11.031.0 129520 Total Equity 10.953.0 11.051.0 220 Total Liabilities And Equity 6022 Supplemental Items Total Shares out on Balance Sheet Date 5417 5178 5042 Cash Flow For the Fiscal Period Ending Rest 12 months Jan-30-2016 USD Rested 12 month Jan-2-2017 USD Road 2 months Fb-03-2010 USD Feb-02-2011 USD 12 months Feb-01-2020 USO Currency Net Income Depreciation Amart Amort of Goodwill and intangible Depreciation 8. Amort, Total 20 21900 220 20140 2100 2.7340 2050 130 2018 2.370 2400 MO 2014 3.2010 25910 10 ZELO 2.4780 (5630 (110 10 9220 2310 1150 7040 30 9070 TO (Gain Loss From Sale Of A Asse Wiedown & Restructuring Cors Stock-Based Compensation NetCash From Discord op Over Operating Advies Change in inverter Change in Ace Payable Change in Other Net Operating A Cash from Ope 1170 10 1120 740 CO (0) 1070 200 3.0 10 3150 1000 5050 (3160 (920 2500 (1660 1330 SAD 110 2170 9730 11.40 (157 (510 2.500 310 5180 10 Co Expenditure Sale of Property, Part, and met Cash Acquisition Divers Invest in Market & Equity Securt Netc.) Decin Long Other leveling A Cash from iting 1050 220 (60) 2010 190 00 INTRO 2. TO UTTA 7330 Sort Term Detved Long-Term Delud Tots Delised trert Term De Red Long-Term Diet Repaid Tots Debt Repaid (26090 266 (2.000 (2.000 (850 (2.1900 suance of Common Stock Repurchase of Common Slack 13.30 (L) 2.00 100 Common Dividende Pad TOIDMdonds Pad ILM (LIMO Seos Dividend Paid Otw Financing Activities Cash from Financing (G Nek Chassin Cash Income Statement For the Fiscal Period Ending Reclassified 12 months Jan-30-2016 USD Restated 12 months Jan-28-2017 USD Rastated 12 months Feb-03-2018 USD 12 months Feb-02-2019 USD 12 months Feb-01-2020 USD Currency 73,785,0 Revenue Other Revenue Total Revenue 69,414,0 857.0 70,271.0 71,788.0 928.0 72,714.0 74,433.0 923.0 75,355.0 77,130.0 982.0 78, 112.0 73,785.0 Cost Of Goods Sold Gross Profit 52.241.0 21,544.0 49,145.0 21,126.0 51.125.0 21,589.0 53,299.0 22.057.0 54 864.0 23, 248.0 14,473.0 14,086.0 14,990.0 15.800.0 16,163.0 Selling General & Admin Exp R&D Exp Depreciation & Amort Other Operating Expense/Income) 1,969.0 2.045.0 2.225.0 2,224.0 2,357.0 Other Operating Exp., Total 16,442.0 16,131.0 17,215.0 17,830.0 18,520.0 Operating Income 5,102.0 4,995.0 4,374.0 4.227.0 4.728.0 (5070) (569.0) (530.0) (4610) (4670) (607.0) (569.0) (530.0) (461.0) (467.0) 20 3,758.0 3.0 4,264,0 4,495.0 4,426.0 3,844.0 (1770) - (410) - 620.0 (150) (920) 3 Interest Expense 4 Interest and Invest income Net Interest Exp 3 7 Other Non-Operating Inc (Exp) 8 EBT Excl. Unusual Items 9 0 Restructuring Charges 1 Impairment of Good 2 Gain (Loss) On Sale Of invest 3 Gain (Loss) On Sale Of Assets 4 Asset Whitedown -5 Other Unusual items 6 EBT Incl. Unusual items 17 18 Income Tax Expense 9 Earnings from Cont. Op 50 51 Earnings of Discontinued Opp 52 Extraord, Item & Account Change 53 Net Income to Company 54 55 Monty Int in Eamingo 56 Net Income (430) (4220) 3.961.0 (910) (123.0) 3,630.0 (23.0 (100) 4.100.0 4,923.0 3,6760 1.0020 3,321.0 1.295 0 2,665,0 72220 2,9080 746.0 2.300 9210 3.269.0 + 68.0 60 70 12.0 420 - 3,3630 2,9140 2.734.0 2,937.0 3.281.0 10 2010 2.917.0 121 Balance Sheet Balance Sheet as of: Jan 30 2016 USD Reclassified Jan-28-2017 USD Restated Feb-03-2018 USD Feb-02-2019 USD Feb-01-2020 USD Currency ASSETS Cash And Equivalents Short Term Investments Total Cash & ST Investments 4,046.0 2,512.0 2.643.0 1.556.0 2.577.0 4,046,0 2,512.0 2,643.0 1,556.0 2,577.0 Accounts Receivable Other Receivables Total Receivables 736.0 736.0 749.0 749.0 929.0 929.0 1,100.0 1,100.0 962.0 562.0 Inventory Prepaid Exp Other Current Assets Total Current Assets 8,601,0 214.0 5330 14,130.0 8.309.0 2070 213.0 11,090.0 8,597.0 1570 214.0 12,540.0 9.4970 157.0 2030 12,510.0 8.992.0 1540 217.0 12.902.0 Gross Property. Plant & Equipment Accumulated Depreciation Net Property, Plant & Equipment 41.463.0 (16,246.0) 25,217.0 42.071.0 (17,413.0) 24,658.0 44,818.0 (18,398.00 26,420.0 46. 185.0 (18,6870) 27.498.0 48.183.0 (19.664.0 28,319.0 630.0 79.0 100 633.0 66 137.0 533.0 53.0 Long-term Investments Goodwil Other Intangibles Deferred Charges, LT Other Long-Term Assets Total Assets 27.0 133.0 61.0 84.0 610.0 40.2620 40 133.0 50.0 76.0 520.0 37.41 634.0 40,301 564.0 41.290.0 535.0 42.779 0 7.418.0 1.942.0 823.0 7.2520 1.866.0 1.718.0 8,877.0 2,0870 2010 228.0 9.7010 2.0340 1,0020 219.0 9,9200 1.9830 94.0 287.0 UABUTES Accounts Payable Accrued Exp Curr. Port of LT Debt Curr. Port of Losses Curr. Income Taxes Payable Uneamed Revenue, Current Other Current Liabilities Total Current Ulabilities 502.0 544.0 1.293.0 12,622.0 158.0 693.0 1.020 12,707.0 721.0 1.1120 13,0520 840.0 1158.0 15,014.0 936.0 1.2880 14,487.0 11,945.0 11,0310 Long-Term Debt Long-Term Louses Uneared Revenue, Non-Current Pensios & Other Post Retire. Benefits Def Tax Liability. Non Our Other Non-Ourrent Liabiles Total Liabilities 660.0 54.0 0230 12010 27,305.0 6300 400 861.0 1.203.0 26,478.0 10,238.0 2.8090 8000 410 6930 1,219,0 28,6520 9.255.0 2,9720 570.0 400 9720 1.170.0 29.993.0 10.035.0 3.578.0 5390 107.0 1 1220 1,0780 30,440.0 + 50.0 5,3480 3.1880 40.0 5,6610 5.8840 45.0 5.858 0 5.495.0 420 5,2250 6,0420 0.0170 Common Stock Additional Paid in Capital Related Eamingo Treasury Stock Comprehensive inc. and Othe Total Common Equity (629.0) 12,957.0 16380) 10,953.0 7470) 11.651,0 BOSO 11,297 0 (860) 11.031.0 129520 Total Equity 10.953.0 11.051.0 220 Total Liabilities And Equity 6022 Supplemental Items Total Shares out on Balance Sheet Date 5417 5178 5042 Cash Flow For the Fiscal Period Ending Rest 12 months Jan-30-2016 USD Rested 12 month Jan-2-2017 USD Road 2 months Fb-03-2010 USD Feb-02-2011 USD 12 months Feb-01-2020 USO Currency Net Income Depreciation Amart Amort of Goodwill and intangible Depreciation 8. Amort, Total 20 21900 220 20140 2100 2.7340 2050 130 2018 2.370 2400 MO 2014 3.2010 25910 10 ZELO 2.4780 (5630 (110 10 9220 2310 1150 7040 30 9070 TO (Gain Loss From Sale Of A Asse Wiedown & Restructuring Cors Stock-Based Compensation NetCash From Discord op Over Operating Advies Change in inverter Change in Ace Payable Change in Other Net Operating A Cash from Ope 1170 10 1120 740 CO (0) 1070 200 3.0 10 3150 1000 5050 (3160 (920 2500 (1660 1330 SAD 110 2170 9730 11.40 (157 (510 2.500 310 5180 10 Co Expenditure Sale of Property, Part, and met Cash Acquisition Divers Invest in Market & Equity Securt Netc.) Decin Long Other leveling A Cash from iting 1050 220 (60) 2010 190 00 INTRO 2. TO UTTA 7330 Sort Term Detved Long-Term Delud Tots Delised trert Term De Red Long-Term Diet Repaid Tots Debt Repaid (26090 266 (2.000 (2.000 (850 (2.1900 suance of Common Stock Repurchase of Common Slack 13.30 (L) 2.00 100 Common Dividende Pad TOIDMdonds Pad ILM (LIMO Seos Dividend Paid Otw Financing Activities Cash from Financing (G Nek Chassin Cash


