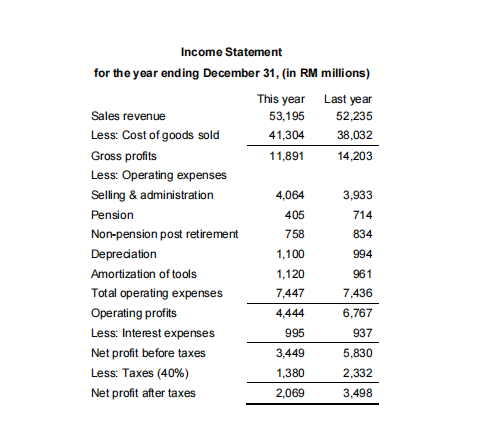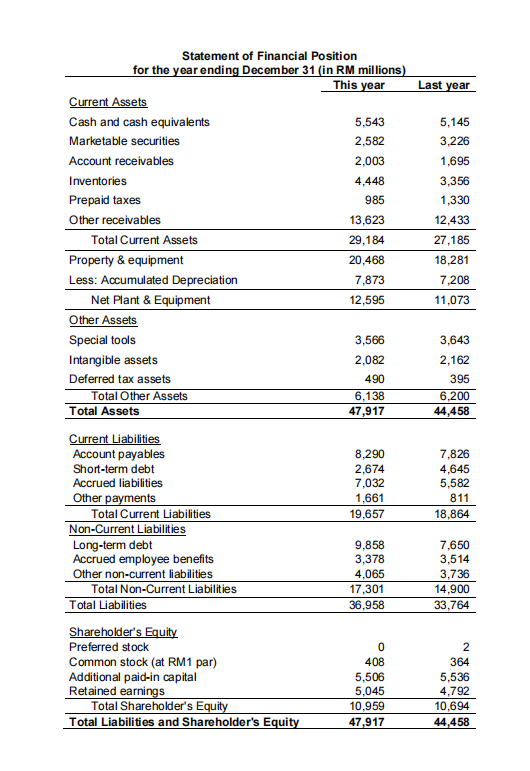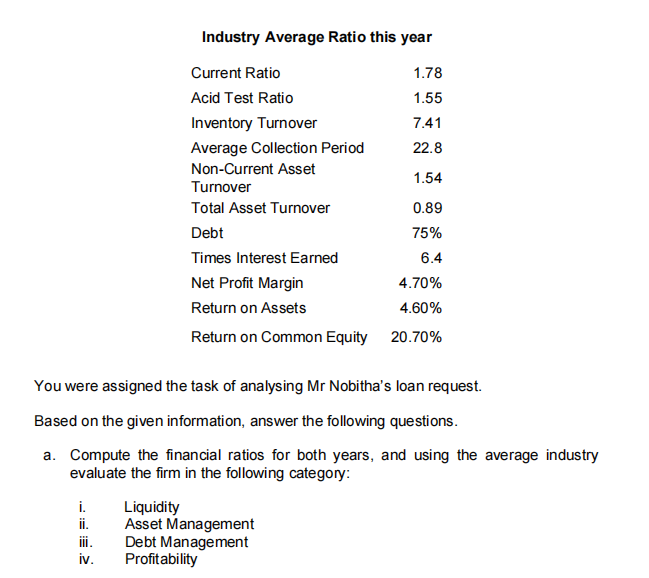


Income Statement for the year ending December 31, (in RM millions) This year Last year Sales revenue 53,195 52,235 Less: Cost of goods sold 41,304 38,032 Gross profits 11,891 14,203 Less: Operating expenses Selling & administration 4,064 3,933 Pension 405 714 Non-pension post retirement 758 834 Depreciation 1,100 994 Amortization of tools 1,120 961 Total operating expenses 7.447 7,436 Operating profits 4,444 6,767 Less: Interest expenses 995 937 Net profit before taxes 3,449 5,830 Less: Taxes (40%) 1,380 2,332 Net profit after taxes 2,069 3,498 Last year Statement of Financial Position for the year ending December 31 (in RM millions) This year Current Assets Cash and cash equivalents 5,543 Marketable securities 2,582 Account receivables 2,003 Inventories 4,448 Prepaid taxes 985 Other receivables 13,623 Total Current Assets 29,184 Property & equipment 20,468 Less: Accumulated Depreciation 7,873 Net Plant & Equipment 12,595 Other Assets Special tools 3,566 Intangible assets 2,082 Deferred tax assets 490 Total Other Assets 6,138 Total Assets 47,917 5,145 3,226 1,695 3,356 1,330 12,433 27,185 18,281 7,208 11,073 3,643 2,162 395 6,200 44,458 8,290 2,674 7,032 1,661 19,657 7.826 4,645 5,582 811 18,864 Current Liabilities Account payables Short-term debt Accrued liabilities Other payments Total Current Liabilities Non-Current Liabilities Long-term debt Accrued employee benefits Other non-current liabilities Total Non-Current Liabilities Total Liabilities Shareholder's Equity Preferred stock Common stock (at RM1 par) Additional paid-in capital Retained earnings Total Shareholder's Equity Total Liabilities and Shareholder's Equity 9,858 3,378 4,065 17,301 36,958 7,650 3,514 3,736 14,900 33,764 0 408 5,506 5,045 10,959 47,917 2 364 5,536 4,792 10,694 44,458 Industry Average Ratio this year Current Ratio 1.78 Acid Test Ratio 1.55 Inventory Turnover 7.41 Average Collection Period 22.8 Non-Current Asset 1.54 Turnover Total Asset Turnover 0.89 Debt 75% Times Interest Earned 6.4 Net Profit Margin 4.70% Return on Assets 4.60% Return on Common Equity 20.70% You were assigned the task of analysing Mr Nobitha's loan request. Based on the given information, answer the following questions. a. Compute the financial ratios for both years, and using the average industry evaluate the firm in the following category: i. ii. Liquidity Asset Management Debt Management Profitability iv


