Answered step by step
Verified Expert Solution
Question
1 Approved Answer
Income Statement (profit and loss) (Year ending 31 Dec) 2010 2011 2012 Sales Revenues TL 47.27760.197 56.006 Cost of Goods Sold TL (35.926) (40.525) (43.497)
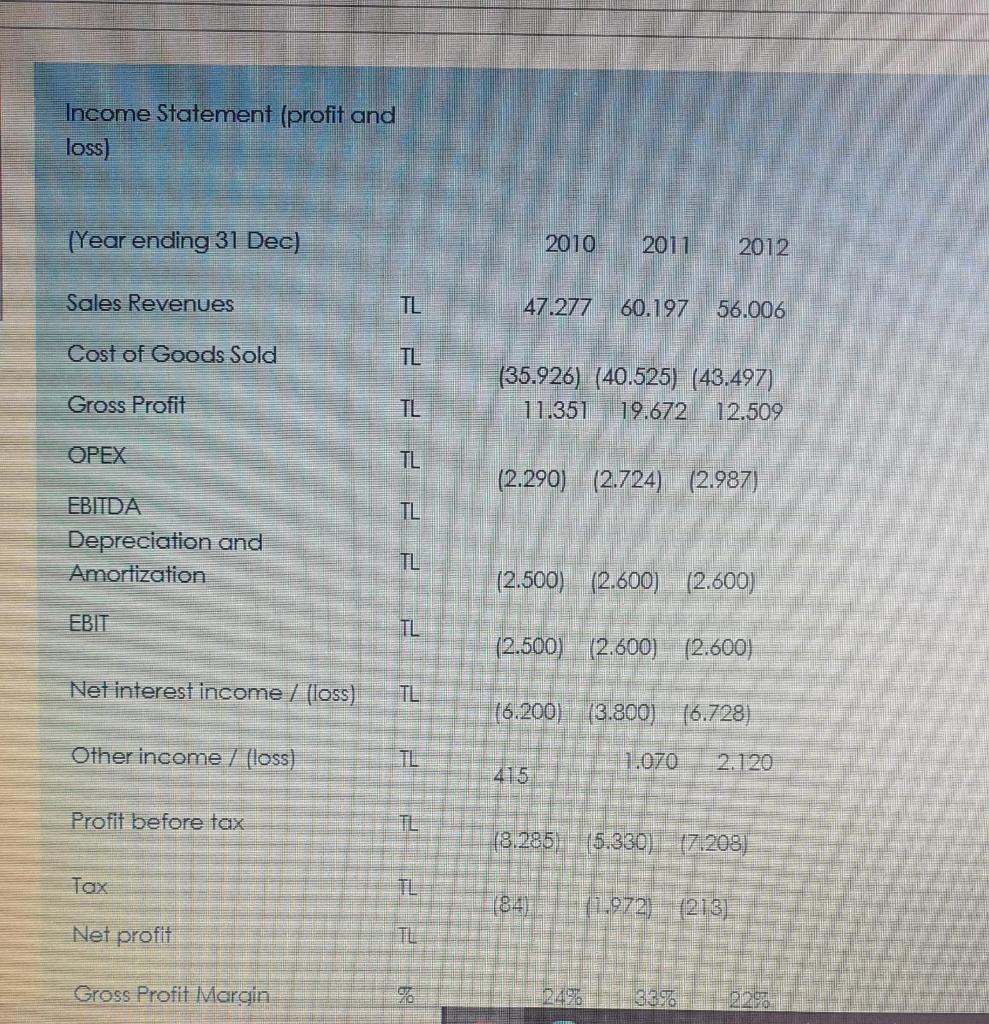
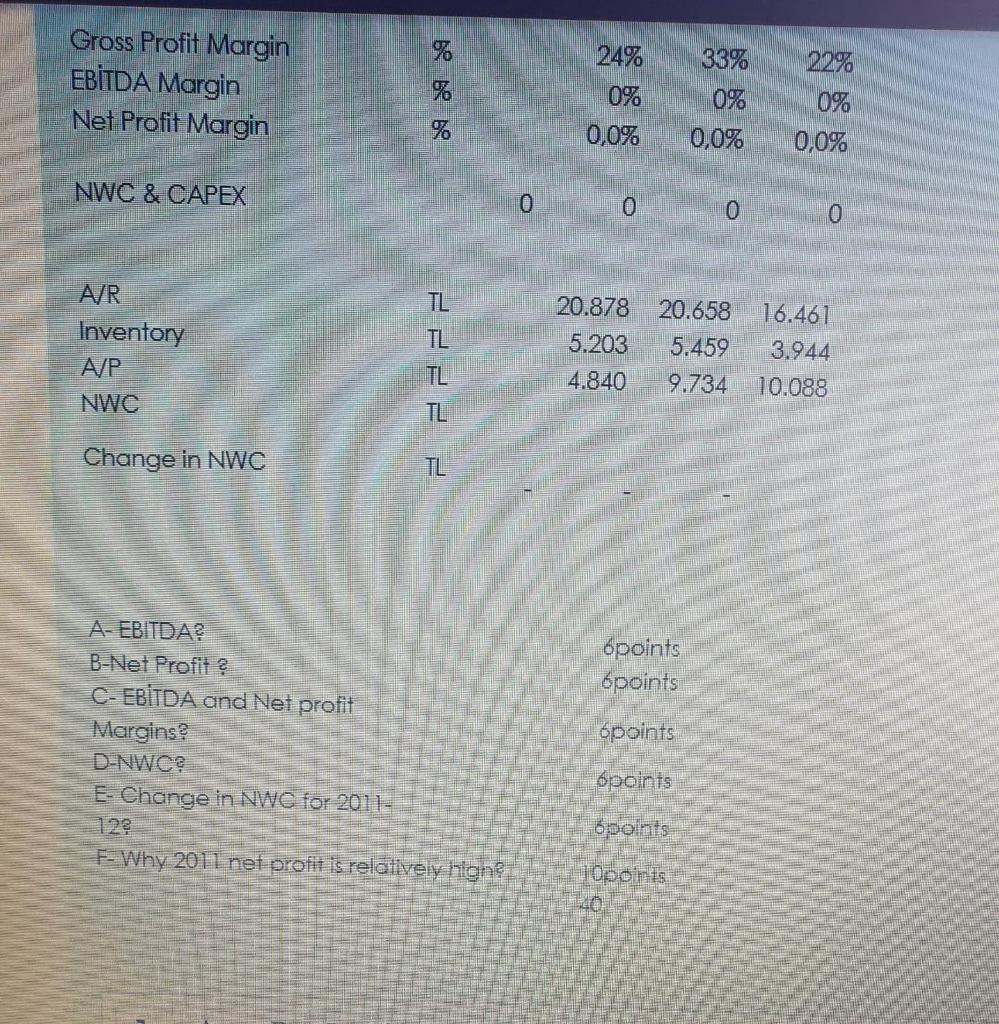
Income Statement (profit and loss) (Year ending 31 Dec) 2010 2011 2012 Sales Revenues TL 47.27760.197 56.006 Cost of Goods Sold TL (35.926) (40.525) (43.497) 11.351 19.672 12.509 Gross Profit TL OPEX (2.290) (2.724) (2.987) TL EBITDA Depreciation and Amortization (2.500) (2.600) (2.600) EBIT (2.500) (2.600) (2.600) Net interest income / (loss) (6.200) (3.800 16.728) Other income / lloss) 1.070 2.120 Profit before tax TL 18.285 (5.330 Tax 11.972) (213) Net profit Gross Profit Marcin 24% 33% Gross Profit Margin EBTDA Margin Net Profit Margin %%% 0% 0% 0,0% 22% 0% 0,0% 0,0% NWC & CAPEX 0 0 0 TL 20.878 20.658 A/R Inventory A/P 16.461 3.944 5.203 5.459 9.734 4.840 10.088 NWC TL Change in NWC TL 6points points - EBITDA? B-Net Profit? C-EBITDA and Net profit Margins? D-NWC E- Change in NWC for 2011- 122 F: Why 2011 net profit is relatively higns points points points TODOS
Step by Step Solution
There are 3 Steps involved in it
Step: 1
Get Instant Access to Expert-Tailored Solutions
See step-by-step solutions with expert insights and AI powered tools for academic success
Step: 2
Step: 3
Ace Your Homework with AI
Get the answers you need in no time with our AI-driven, step-by-step assistance
Get Started