Income Statement question (4 Part): (Please include how you got the answer)
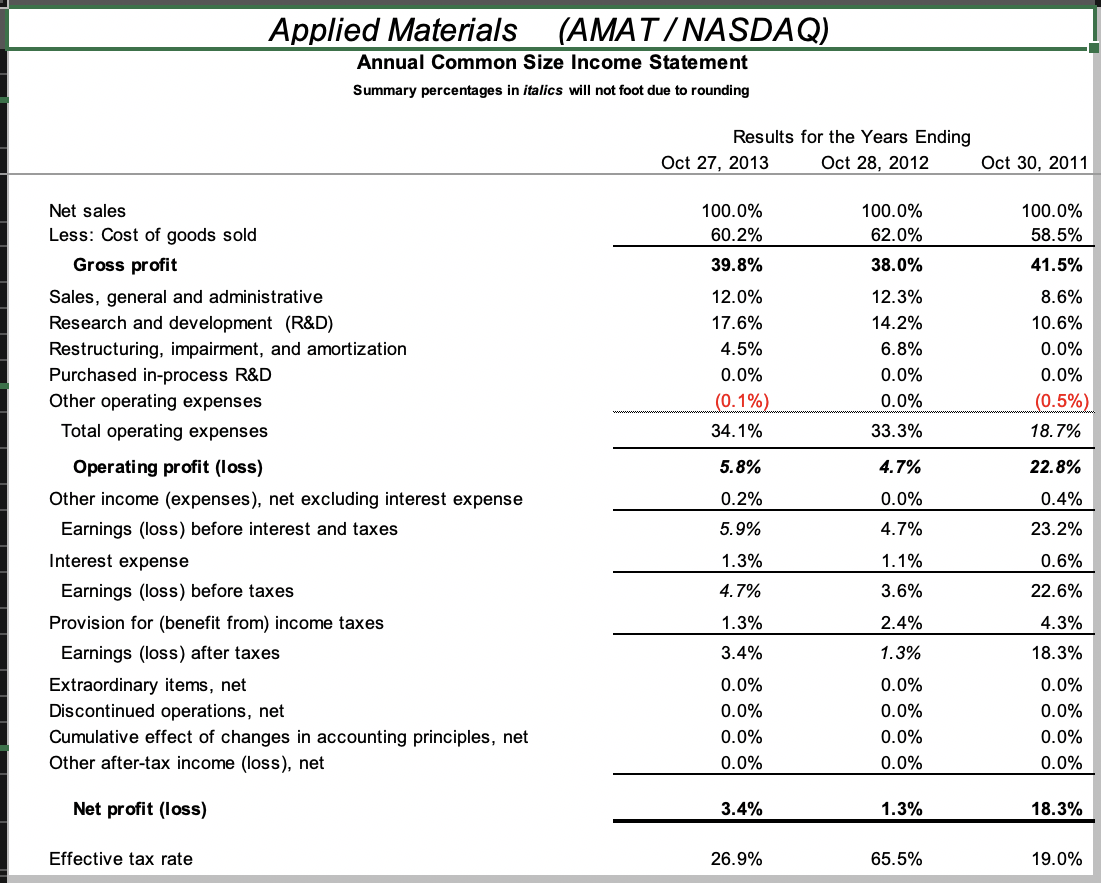
- What is included in Other Income (expenses)? Explain these accounts.
- What was Interest Expense? What was it as a percentage to net sales?
- What was the companys effective tax rate (Taxes/Earnings B4 Taxes)? Was it this rate stable or volatile?
- What happened to the companys net profit margin? Are there any plans for improvement of net income? I have posted every piece of information I have to answer this question.
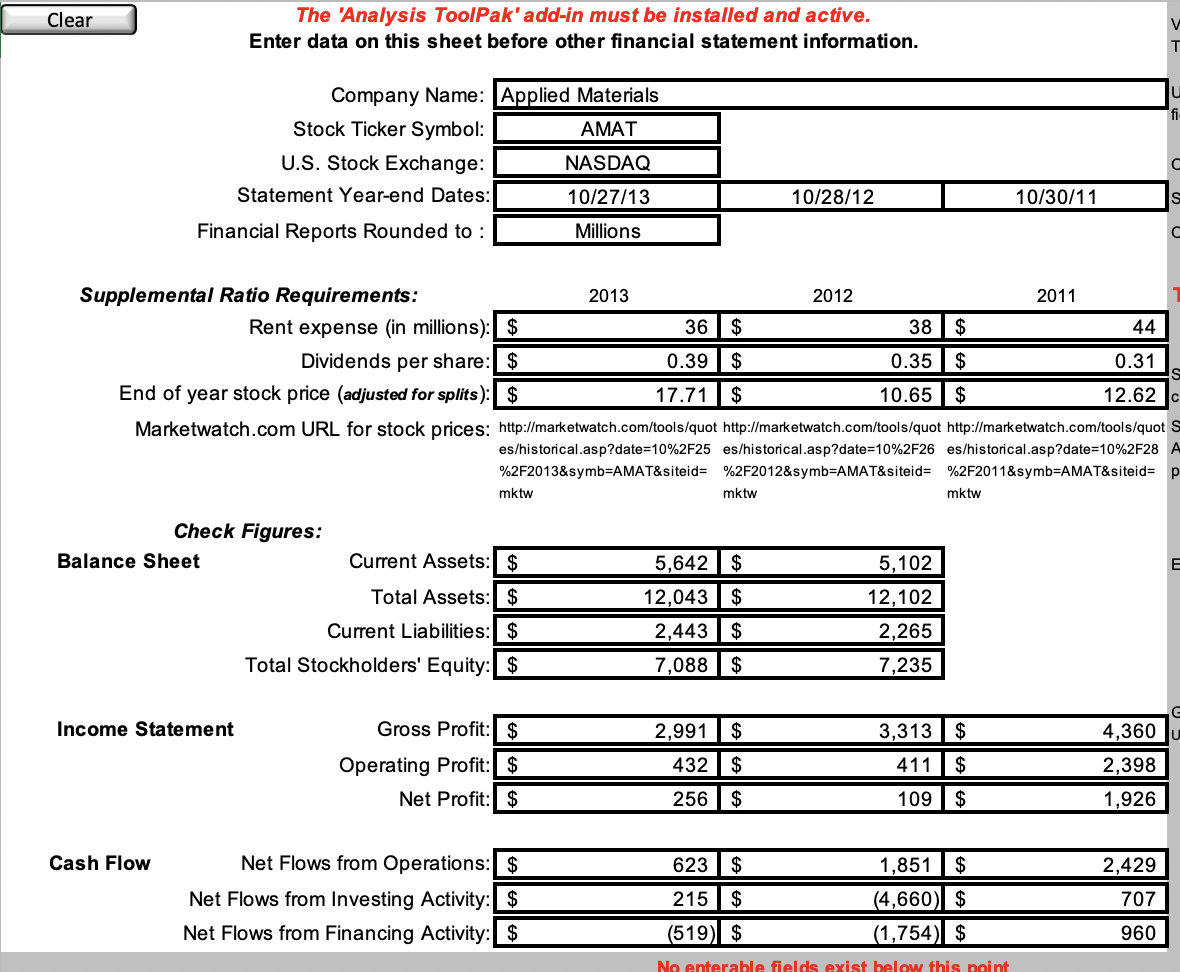
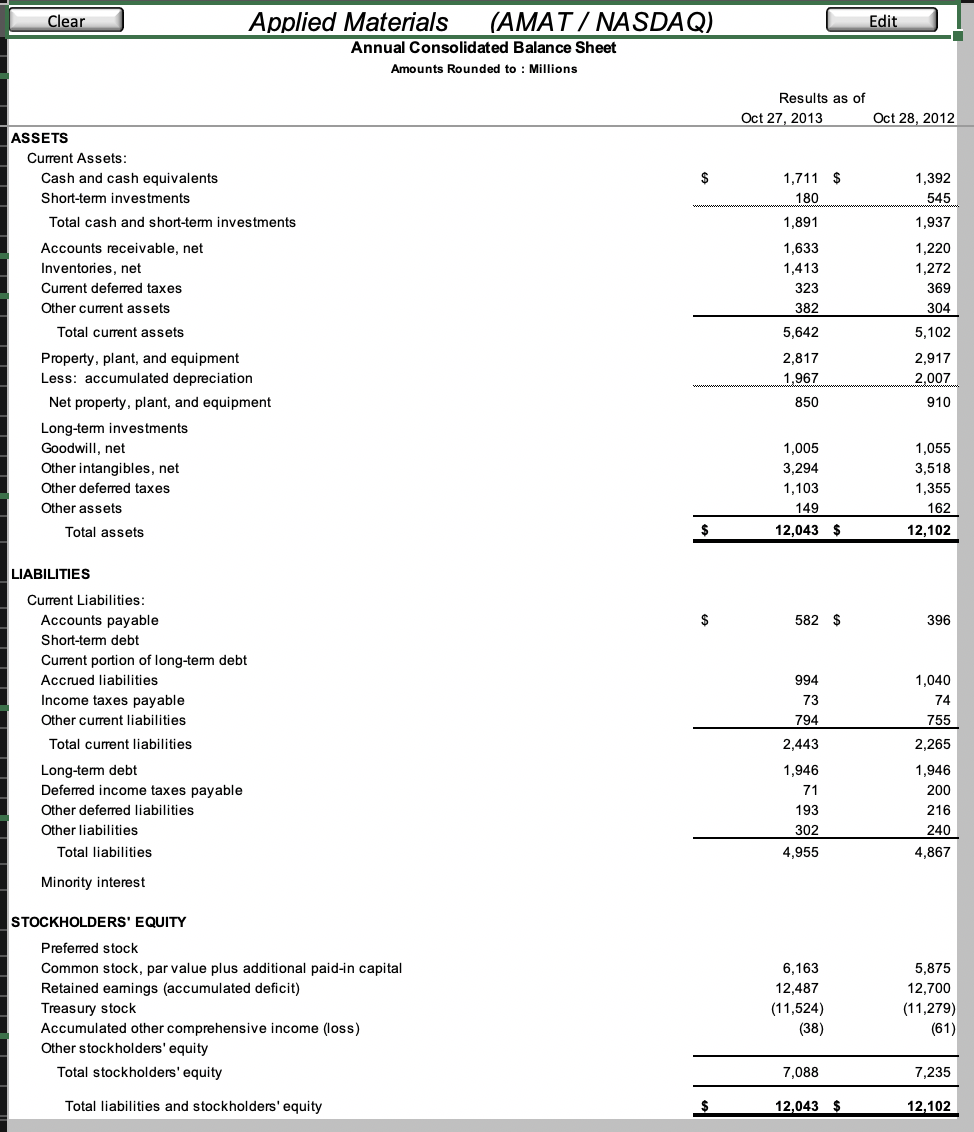
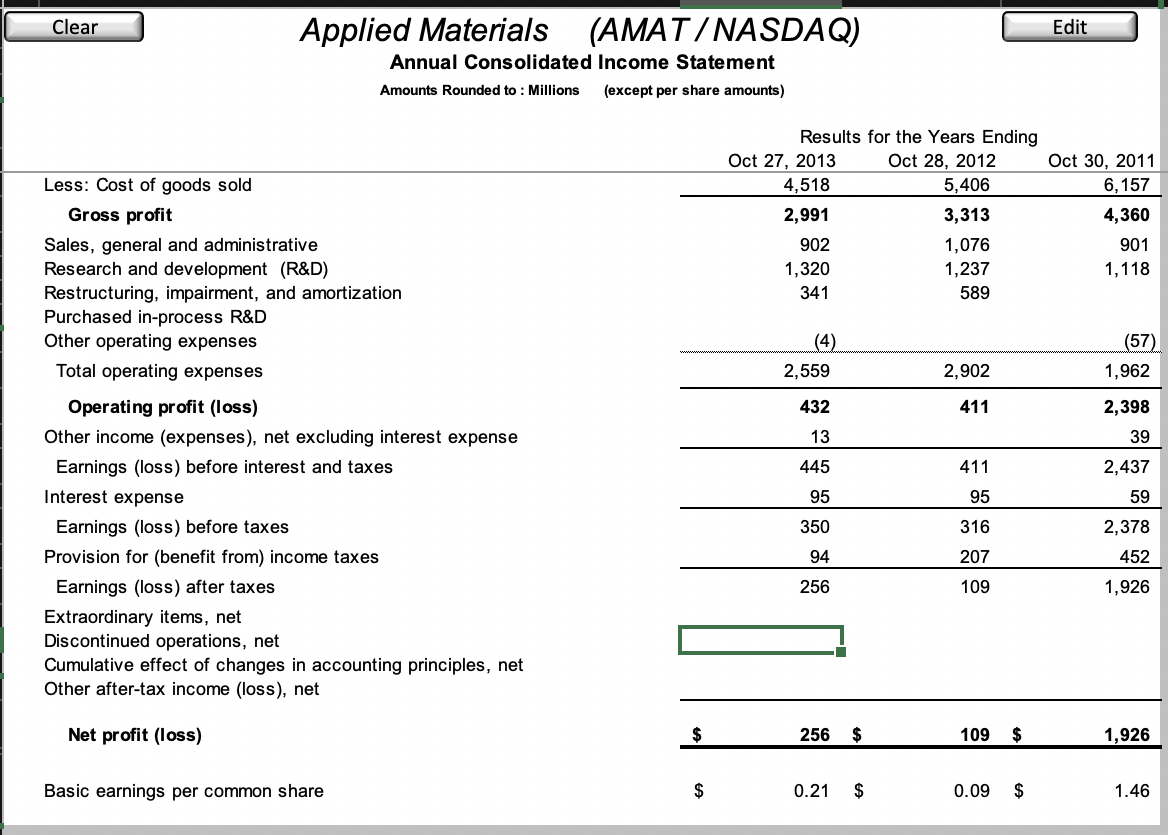
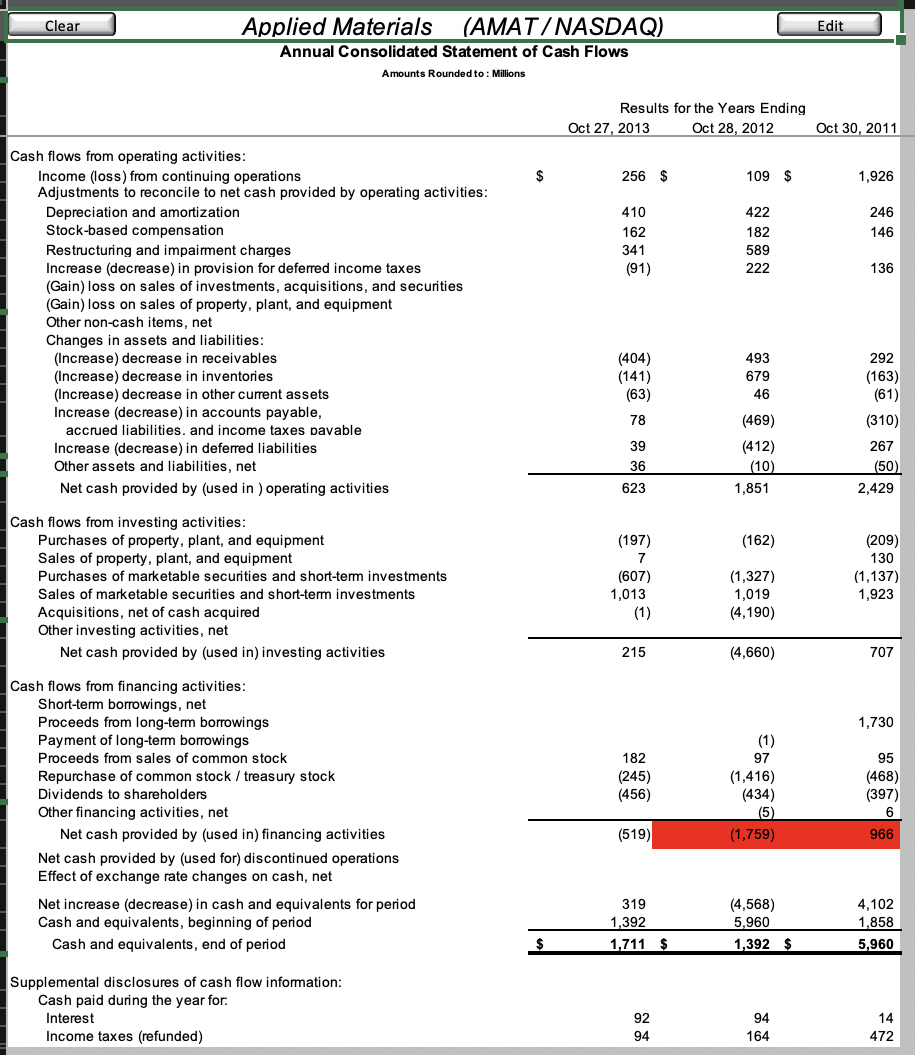
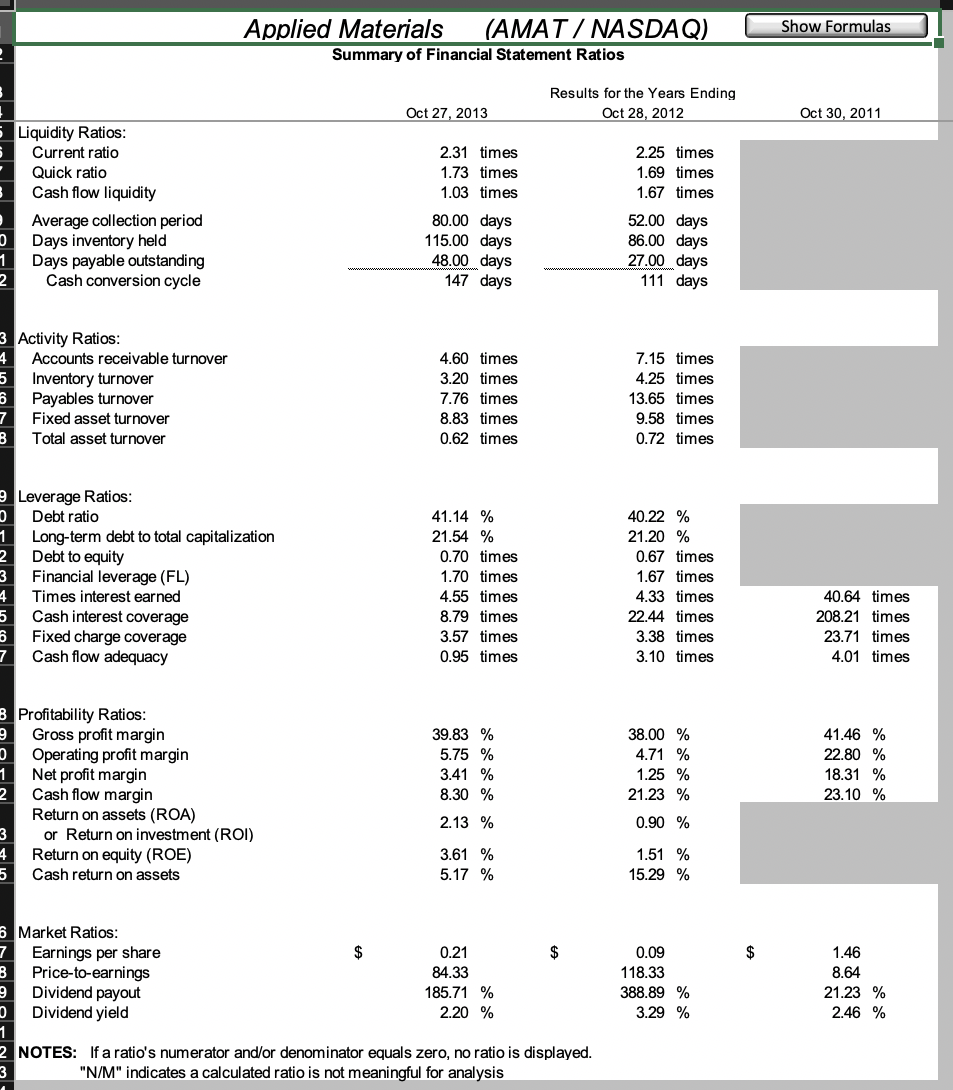
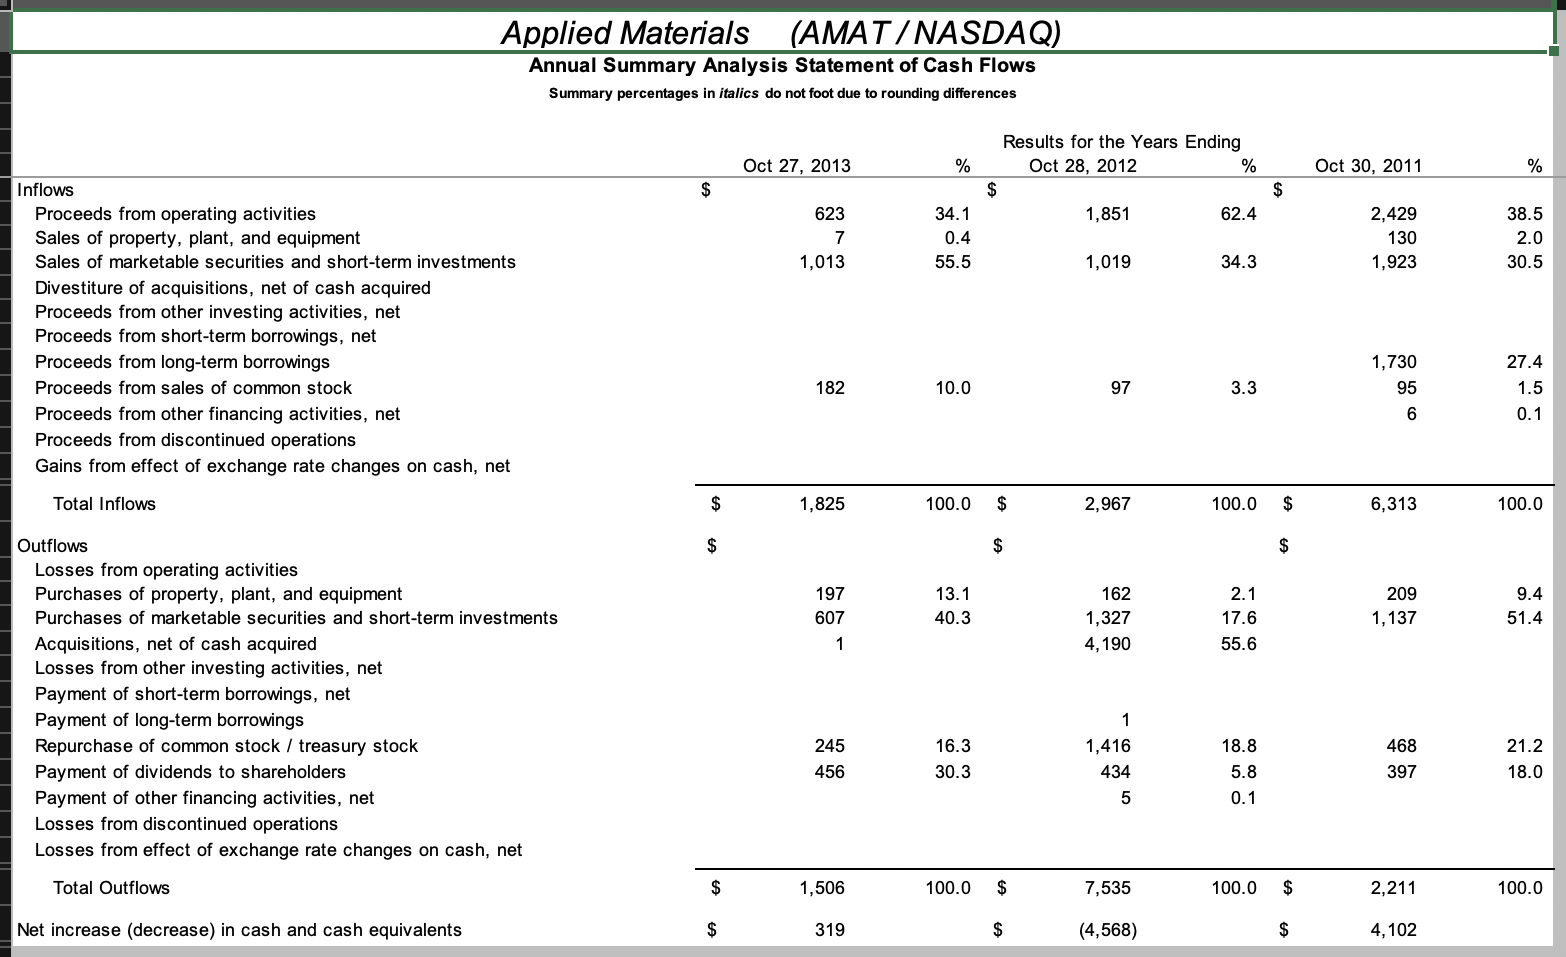
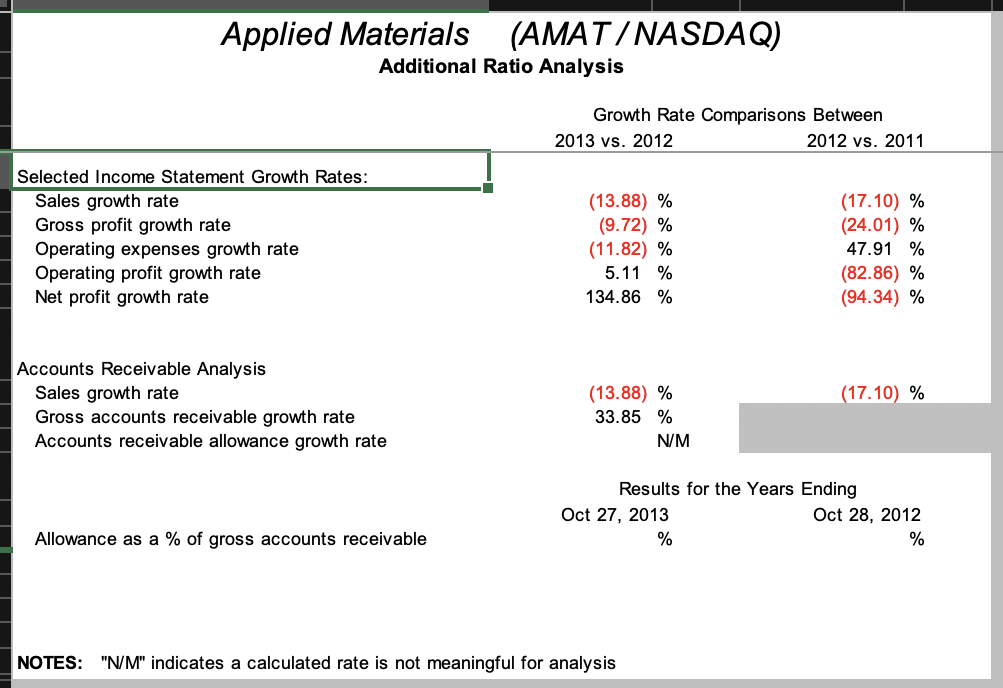
Clear The 'Analysis ToolPak'add-in must be installed and active. Enter data on this sheet before other financial statement information. Company Name: Applied Materials Stock Ticker Symbol: AMAT U.S. Stock Exchange: NASDAQ Statement Year-end Dates: 10/27/13 Financial Reports Rounded to: Millions 10/28/12 10/30/11 Supplemental Ratio Requirements: 2013 2012 2011 Rent expense (in millions): $ 36 $ 38 $ 44 Dividends per share: $ 0.39 $ 0.35 $ 0.31 End of year stock price (adjusted for splits): $ 17.71 $ 10.65 $ 12.62 C Marketwatch.com URL for stock prices: http://marketwatch.com/tools/quot http://marketwatch.com/tools/quot http://marketwatch.com/tools/quot S es/historical.asp?date=10%2F25 es/historical.asp?date=10%2F26 es/historical.asp?date=10%2F28 A %2F2013&symb=AMAT&siteid= %2F2012&symb=AMAT&siteid= %2F2011&symb=AMAT&siteid= p mktw mktw mktw 5,102 E Check Figures: Balance Sheet Current Assets: $ Total Assets: $ Current Liabilities: $ Total Stockholders' Equity: $ 12,102 5,642 $ 12,043 $ 2,443 $ 7,088 $ 2,265 7,235 Income Statement 4,360 Gross Profit: $ Operating Profit: $ Net Profit: $ 2,991 $ 432 $ 256 $ 3,313 $ 411$ 109 $ 2,398 1,926 Cash Flow Net Flows from Operations: $ Net Flows from Investing Activity: $ Net Flows from Financing Activity: $ 623 $ 215 $ (519) $ 1,851 $ (4,660) $ (1,754) $ 2,429 707 960 No antarable fields exist below this point Clear Edit ! Applied Materials (AMAT / NASDAQ) Annual Consolidated Balance Sheet Amounts Rounded to : Millions Results as of Oct 27, 2013 Oct 28, 2012 ASSETS Current Assets: Cash and cash equivalents Short-term investments Total cash and short-term investments Accounts receivable, net Inventories, net Current deferred taxes Other current assets 1,711 $ 180 1,891 1,633 1,413 323 382 5,642 2,817 1,967 850 1,392 545 1,937 1,220 1,272 369 304 5,102 2,917 2,007 910 Total current assets Property, plant, and equipment Less: accumulated depreciation Net property, plant, and equipment Long-term investments Goodwill, net Other intangibles, net Other deferred taxes Other assets Total assets 1,005 3,294 1,103 149 12,043 $ 1,055 3,518 1,355 162 12,102 582 $ 396 LIABILITIES Current Liabilities: Accounts payable Short-term debt Current portion of long-term debt Accrued liabilities Income taxes payable Other current liabilities Total current liabilities 994 73 794 1,040 74 755 2,265 1,946 200 2,443 Long-term debt Deferred income taxes payable Other deferred liabilities Other liabilities Total liabilities 1,946 71 193 302 4,955 216 240 4,867 Minority interest STOCKHOLDERS' EQUITY Preferred stock Common stock, par value plus additional paid-in capital Retained earnings (accumulated deficit) Treasury stock Accumulated other comprehensive income (loss) Other stockholders' equity Total stockholders' equity 6,163 12,487 (11,524) (38) 5,875 12,700 (11,279) (61) 7,088 7,235 Total liabilities and stockholders' equity $ 12,043 $ 12,102 Clear Edit Applied Materials (AMAT /NASDAQ) Annual Consolidated Income Statement Amounts Rounded to: Millions (except per share amounts) Results for the Years Ending Oct 27, 2013 Oct 28, 2012 Oct 30, 2011 4,518 5,406 6,157 2,991 3,313 4,360 902 1,076 901 1,320 1,237 1,118 341 589 (57) 2,902 1,962 2,559 432 13 411 Less: Cost of goods sold Gross profit Sales, general and administrative Research and development (R&D) Restructuring, impairment, and amortization Purchased in-process R&D Other operating expenses Total operating expenses Operating profit (loss) Other income (expenses), net excluding interest expense Earnings (loss) before interest and taxes Interest expense Earnings (loss) before taxes Provision for benefit from) income taxes Earnings (loss) after taxes Extraordinary items, net Discontinued operations, net Cumulative effect of changes in accounting principles, net Other after-tax income (loss), net 2,398 39 445 2,437 95 59 350 94 256 411 95 316 207 109 2,378 452 1,926 Net profit (loss) 256 $ 109 $ 1,926 Basic earnings per common share $ 0.21 $ 0.09 $ 1.46 Clear Edit Applied Materials (AMAT/NASDAQ) Annual Consolidated Statement of Cash Flows Amounts Rounded to: Millions Results for the Years Ending Oct 27, 2013 Oct 28, 2012 Oct 30, 2011 256 $ 109 $ 1,926 422 410 162 182 341 589 222 (91) Cash flows from operating activities: Income (loss) from continuing operations Adjustments to reconcile to net cash provided by operating activities: Depreciation and amortization Stock-based compensation Restructuring and impairment charges Increase (decrease) in provision for deferred income taxes (Gain) loss on sales of investments, acquisitions, and securities (Gain) loss on sales of property, plant, and equipment Other non-cash items, net Changes in assets and liabilities: (Increase) decrease in receivables (Increase) decrease in inventories (Increase) decrease in other current assets Increase (decrease) in accounts payable, accrued liabilities, and income taxes pavable Increase (decrease) in deferred liabilities Other assets and liabilities, net Net cash provided by (used in ) operating activities (404) (141) (63) 78 493 679 46 292 (163) (61) (310) 39 267 (469) (412) (10) 1,851 36 (50) 2,429 623 (197) (162) Cash flows from investing activities: Purchases of property, plant, and equipment Sales of property, plant, and equipment Purchases of marketable securities and short-term investments Sales of marketable securities and short-term investments Acquisitions, net of cash acquired Other investing activities, net Net cash provided by (used in) investing activities (209) 130 (1,137) 1,923 (607) 1,013 (1) (1,327) 1,019 (4,190) 215 (4,660) 707 1,730 95 182 (245) (456) (1) 97 (1,416) (434) (468) (397) Cash flows from financing activities: Short-term borrowings, net Proceeds from long-term borrowings Payment of long-term borrowings Proceeds from sales of common stock Repurchase of common stock /treasury stock Dividends to shareholders Other financing activities, net Net cash provided by (used in) financing activities Net cash provided by (used for) discontinued operations Effect of exchange rate changes on cash, net Net increase (decrease) in cash and equivalents for period Cash and equivalents, beginning of period Cash and equivalents, end of period (5) (519) (1,759) 966 319 1,392 1,711 $ (4,568) 5,960 1,392 $ 4,102 1,858 5,960 Supplemental disclosures of cash flow information: Cash paid during the year for. Interest Income taxes (refunded) 94 164 14 472 L Show Formulas Applied Materials (AMAT / NASDAQ) Summary of Financial Statement Ratios " Results for the Years Ending Oct 28, 2012 Oct 27, 2013 Oct 30, 2011 Liquidity Ratios: Current ratio Quick ratio Cash flow liquidity Average collection period Days inventory held Days payable outstanding Cash conversion cycle 2.31 times 1.73 times 1.03 times 80.00 days 115.00 days 48.00 days 147 days 2.25 times 1.69 times 1.67 times 52.00 days 86.00 days 27.00 days 111 days 1 2 3 Activity Ratios: 4 Accounts receivable turnover 5 Inventory turnover 6 Payables turnover 7 Fixed asset turnover B Total asset turnover 4.60 times 3.20 times 7.76 times 8.83 times 0.62 times 7.15 times 4.25 times 13.65 times 9.58 times 0.72 times 9 Leverage Ratios: D Debt ratio 1 Long-term debt to total capitalization 2 Debt to equity 3 Financial leverage (FL) Times interest earned 5 Cash interest coverage Fixed charge coverage Cash flow adequacy 41.14 % 21.54 % 0.70 times 1.70 times 4.55 times 8.79 times 3.57 times 0.95 times 40.22% 21.20 % 0.67 times 1.67 times 4.33 times 22.44 times 3.38 times 3.10 times 40.64 times 208.21 times 23.71 times 4.01 times B Profitability Ratios: 9 Gross profit margin 0 Operating profit margin Net profit margin Cash flow margin Return on assets (ROA) 3 or Return on investment (ROI) 4 Return on equity (ROE) Cash return on assets 39.83 % 5.75 % 3.41 % 8.30 % 2.13 % 3.61 % 5.17 % 38.00 % 4.71 % 1.25 % 21.23 % 0.90 % 41.46 % 22.80 % 18.31 % 23.10 % 1.51 % 15.29 % $ 6 Market Ratios: 7 Earnings per share B Price-to-earnings 9 Dividend payout D Dividend yield 0.21 84.33 185.71 % 2.20 % 0.09 118.33 388.89 % 3.29 % 1.46 8.64 21.23 % 2.46 % 2 NOTES: If a ratio's numerator and/or denominator equals zero, no ratio is displayed. "N/M" indicates a calculated ratio is not meaningful for analysis 3 Applied Materials (AMAT / NASDAQ) Annual Common Size Balance Sheet Summary percentages in italics will not foot due to rounding Results as of Oct 27, 2013 Oct 28, 2012 ASSETS Current Assets: Cash and cash equivalents Short-term investments Total cash and short-term investments Accounts receivable, net Inventories, net Current deferred taxes Other current assets Total current assets Property, plant, and equipment Less: accumulated depreciation Net property, plant, and equipment Long-term investments Goodwill, net Other intangibles, net Other deferred taxes Other assets Total assets 11.5% 4.5% 16.0% 10.1% 10.5% 3.0% 2.5% 42.2% 14.2% 1.5% 15.7% 13.6% 11.7% 2.7% 3.2% 46.8% 23.4% 16.3% 7.1% 0.0% 8.3% 27.4% 9.2% 1.2% 100.0% 24.1% 16.6% 7.5% 0.0% 8.7% 29.1% 11.2% 1.3% 100.0% LIABILITIES Current Liabilities: Accounts payable Short-term debt Current portion of long-term debt Accrued liabilities Income taxes payable Other current liabilities Total current liabilities Long-term debt Deferred income taxes payable Other deferred liabilities Other liabilities Total liabilities 4.8% 0.0% 0.0% 8.3% 0.6% 6.6% 20.3% 16.2% 0.6% 1.6% 2.5% 41.1% 0.0% 3.3% 0.0% 0.0% 8.6% 0.6% 6.2% 18.7% 16.1% 1.7% 1.8% 2.0% 40.2% 0.0% Minority interest STOCKHOLDERS' EQUITY Preferred stock Common stock, par value plus additional paid-in capital Retained earnings (accumulated deficit) Treasury stock Accumulated other comprehensive income (loss) Other stockholders' equity Total stockholders' equity 0.0% 51.2% 103.7% (95.7%) (0.3%) 0.0% 58.9% 0.0% 48.5% 104.9% (93.2%) (0.5%) 0.0% 59.8% Total liabilities and stockholders' equity 100.0% 100.0% Applied Materials (AMAT/NASDAQ) Annual Common Size Income Statement Summary percentages in italics will not foot due to rounding Results for the Years Ending Oct 27, 2013 Oct 28, 2012 Oct 30, 2011 100.0% 58.5% 41.5% 100.0% 60.2% 39.8% 12.0% 17.6% 4.5% 0.0% (0.1%) 34.1% 100.0% 62.0% 38.0% 12.3% 14.2% 6.8% 0.0% 0.0% 33.3% 8.6% 10.6% 0.0% 0.0% (0.5%) 18.7% Net sales Less: Cost of goods sold Gross profit Sales, general and administrative Research and development (R&D) Restructuring, impairment, and amortization Purchased in-process R&D Other operating expenses Total operating expenses Operating profit (loss) Other income (expenses), net excluding interest expense Earnings (loss) before interest and taxes Interest expense Earnings (loss) before taxes Provision for (benefit from) income taxes Earnings (loss) after taxes Extraordinary items, net Discontinued operations, net Cumulative effect of changes in accounting principles, net Other after-tax income (loss), net 5.8% 0.2% 5.9% 1.3% 4.7% 1.3% 3.4% 0.0% 0.0% 0.0% 0.0% 4.7% 0.0% 4.7% 1.1% 3.6% 2.4% 1.3% 0.0% 0.0% 0.0% 0.0% 22.8% 0.4% 23.2% 0.6% 22.6% 4.3% 18.3% 0.0% 0.0% 0.0% 0.0% Net profit (loss) 3.4% 1.3% 18.3% Effective tax rate 26.9% 65.5% 19.0% Applied Materials (AMAT /NASDAQ) Annual Summary Analysis Statement of Cash Flows Summary percentages in italics do not foot due to rounding differences Oct 27, 2013 Results for the Years Ending Oct 28, 2012 % Oct 30, 2011 623 34.1 1,851 62.4 0.4 2,429 130 1,923 38.5 2.0 30.5 1,013 55.5 1,019 34.3 Inflows Proceeds from operating activities Sales of property, plant, and equipment Sales of marketable securities and short-term investments Divestiture of acquisitions, net of cash acquired Proceeds from other investing activities, net Proceeds from short-term borrowings, net Proceeds from long-term borrowings Proceeds from sales of common stock Proceeds from other financing activities, net Proceeds from discontinued operations Gains from effect of exchange rate changes on cash, net 1,730 182 10.0 - 97 3.3 27.4 1.5 0.1 Total Inflows 1,825 100.0 $ 2,967 100.0 $ 6,313 100.0 A 197 2.1 13.1 40.3 162 1,327 4,190 209 1,137 9.4 51.4 607 17.6 55.6 Outflows Losses from operating activities Purchases of property, plant, and equipment Purchases of marketable securities and short-term investments Acquisitions, net of cash acquired Losses from other investing activities, net Payment of short-term borrowings, net Payment of long-term borrowings Repurchase of common stock / treasury stock Payment of dividends to shareholders Payment of other financing activities, net Losses from discontinued operations Losses from effect of exchange rate changes on cash, net 245 456 16.3 30.3 1,416 434 18.8 5.8 0.1 468 397 21.2 18.0 5 Total Outflows 1,506 100.0 $ 7,535 100.0 $ 2,211 100.0 Net increase (decrease) in cash and cash equivalents 319 (4,568) 4,102 Applied Materials (AMAT/NASDAQ) Additional Ratio Analysis Growth Rate Comparisons Between 2013 vs. 2012 2012 vs. 2011 Selected Income Statement Growth Rates: Sales growth rate Gross profit growth rate Operating expenses growth rate Operating profit growth rate Net profit growth rate (13.88) % (9.72) % (11.82) % 5.11 % 134.86 % (17.10) % (24.01) % 47.91 % (82.86) % (94.34) % Accounts Receivable Analysis Sales growth rate Gross accounts receivable growth rate Accounts receivable allowance growth rate (13.88) % 33.85 % (17.10) % NM Results for the Years Ending Oct 27, 2013 Oct 28, 2012 Allowance as a % of gross accounts receivable NOTES: "N/M" indicates a calculated rate is not meaningful for analysis