

Answered step by step
Verified Expert Solution
Question
1 Approved Answer
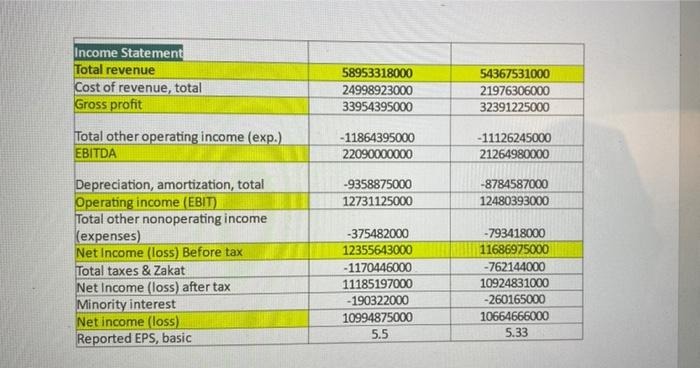
Income Statement Total revenue Cost of revenue, total Gross profit 58953318000 24998923000 33954395000 54367531000 21976306000 32391225000 Total other operating income (exp.) EBITDA -11864395000 22090000000 -
Step by Step Solution
There are 3 Steps involved in it
Step: 1

Get Instant Access to Expert-Tailored Solutions
See step-by-step solutions with expert insights and AI powered tools for academic success
Step: 2

Step: 3
Ace Your Homework with AI
Get the answers you need in no time with our AI-driven, step-by-step assistance
Get Started
Divine Dollars And Digital Gold
Authors: Finally Detached
1st Edition
979-8859504534