

Answered step by step
Verified Expert Solution
Question
1 Approved Answer
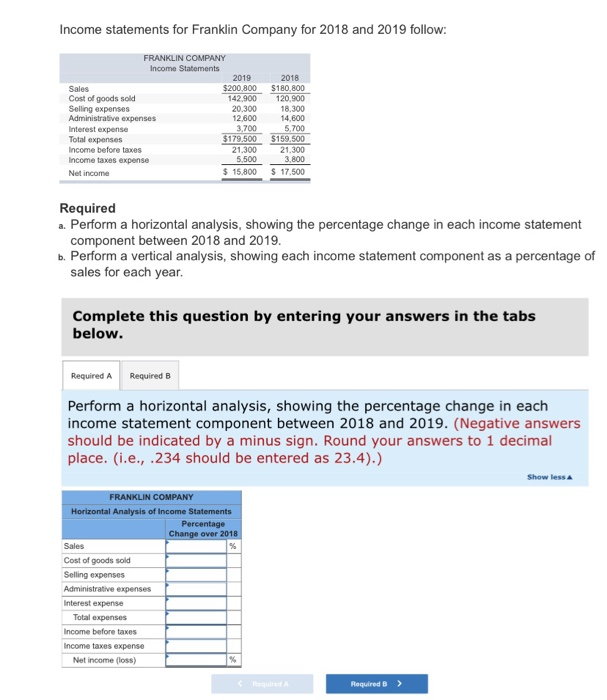
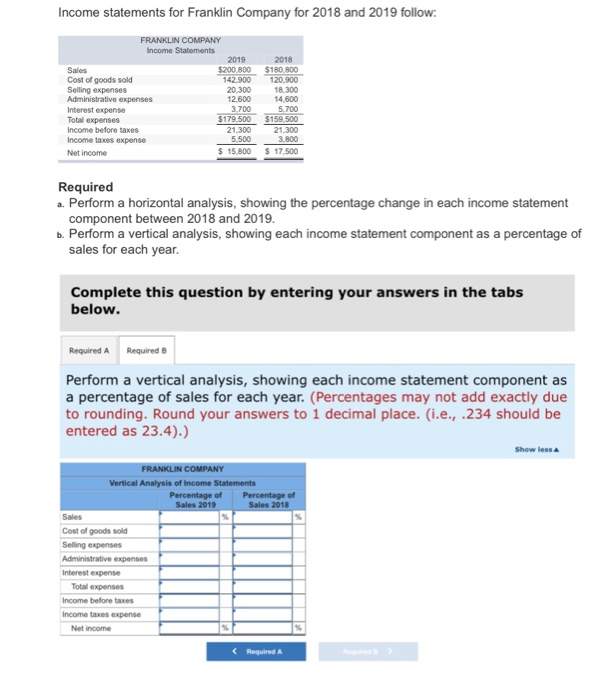
Income statements for Franklin Company for 2018 and 2019 follow: FRANKLIN COMPANY Income Statements 2019 Sales Cost of goods sold Selling expenses Administrative expenses Interest
Step by Step Solution
There are 3 Steps involved in it
Step: 1

Get Instant Access to Expert-Tailored Solutions
See step-by-step solutions with expert insights and AI powered tools for academic success
Step: 2

Step: 3
Ace Your Homework with AI
Get the answers you need in no time with our AI-driven, step-by-step assistance
Get Started
Financial Accounting A Management Perspective
Authors: Nelson Macwan
1st Edition
6206142191, 978-6206142195