

Answered step by step
Verified Expert Solution
Question
1 Approved Answer
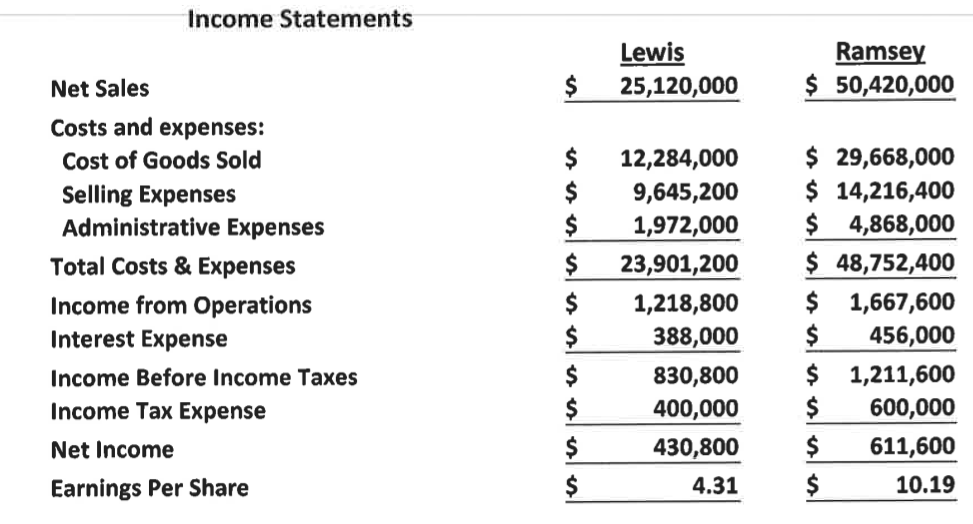
Income Statements Lewis 25,120,000 Ramsey $ 50,420,000 Net Sales $ Costs and expenses: Cost of Goods Sold Selling Expenses Administrative Expenses Total Costs & Expenses
Step by Step Solution
There are 3 Steps involved in it
Step: 1

Get Instant Access to Expert-Tailored Solutions
See step-by-step solutions with expert insights and AI powered tools for academic success
Step: 2

Step: 3
Ace Your Homework with AI
Get the answers you need in no time with our AI-driven, step-by-step assistance
Get Started
Financial Accounting Oakton Community College Tools For Business Decision Making
Authors: Paul D. Kimmel ,Jerry J. Weygandt ,Donald E. Kieso
6th Edition
1118113632, 978-1118113639