Answered step by step
Verified Expert Solution
Link Copied!

Question

1 Approved Answer

Income Statements Liquidity Ratios: Fimancial Leverage: 2012 2013 Change 2012 2013 Chauge Industry $1,300,000 $1,500,000 $1,800,000 Total-Debt-to-Total-Assets NWC-to-Total Assets Debt-to-Equity Ratio Current-Liab-to-Total Debt Cash Conversion
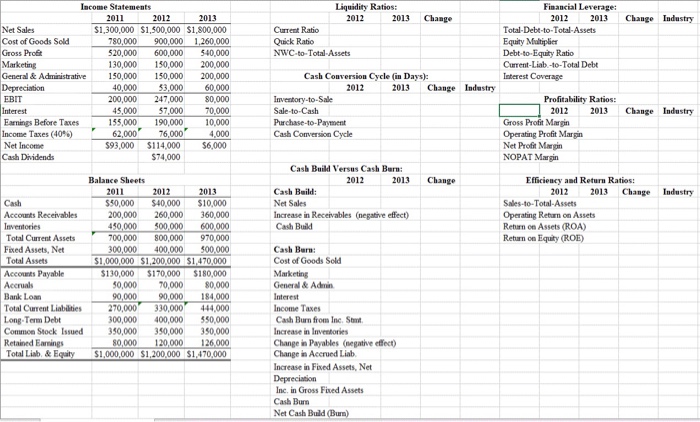
image text in transcribed
Income Statements Liquidity Ratios: Fimancial Leverage: 2012 2013 Change 2012 2013 Chauge Industry $1,300,000 $1,500,000 $1,800,000 Total-Debt-to-Total-Assets NWC-to-Total Assets Debt-to-Equity Ratio Current-Liab-to-Total Debt Cash Conversion Cycle (in Days) 2012 2013 Change Industry Profitability Ratios: 2012 2013 Change Industry Profit Margin NOPAT Margin Cash Build Versus Cash Burn: Balance Sheets 2012 013 Change Efficiency and Return Ratios 2012 2013 Change Industry Increase in Receivables (negative effect) Operating Return on Assets Return on Assets (ROA) Return on Equity (ROE) Cost of Goods Sold $1,000,000 $1,200,000 $1,470,000 130,000 $170,000 $180,000 Cash Burn from Inc, Sn Change in Payables (negative effect) Change in Acerued Liab Increase in Fixed Assets, Net $1,000,000 $1,200,000 $1,470,000 Inc. in Gross Fixed Assets

Step by Step Solution

There are 3 Steps involved in it

Step: 1

blur-text-image

Get Instant Access to Expert-Tailored Solutions

See step-by-step solutions with expert insights and AI powered tools for academic success

Step: 2

blur-text-image

Step: 3

blur-text-image

Ace Your Homework with AI

Get the answers you need in no time with our AI-driven, step-by-step assistance

Get Started

Recommended Textbook for

Management Audit A Complete Guide

Authors: Gerardus Blokdyk

2020 Edition

0655905413, 978-0655905417

More Books

Students also viewed these Accounting questions

Question

6. Explain the power of labels.

Answered: 1 week ago

Question

10. Discuss the complexities of language policies.

Answered: 1 week ago