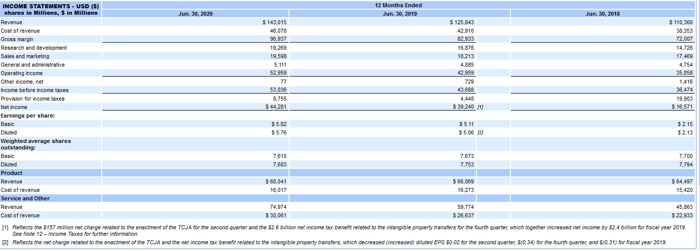
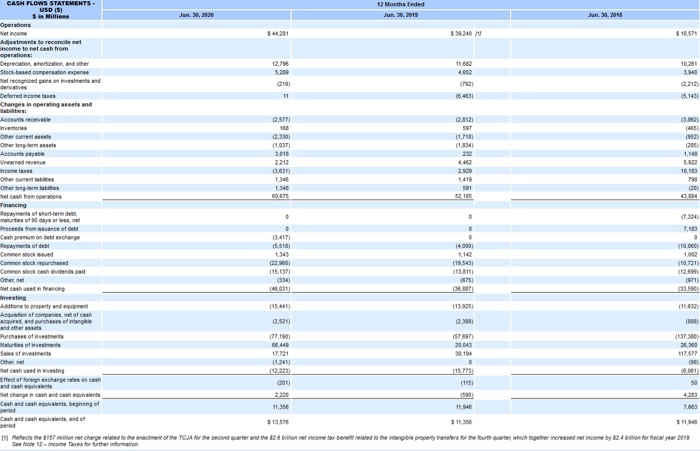
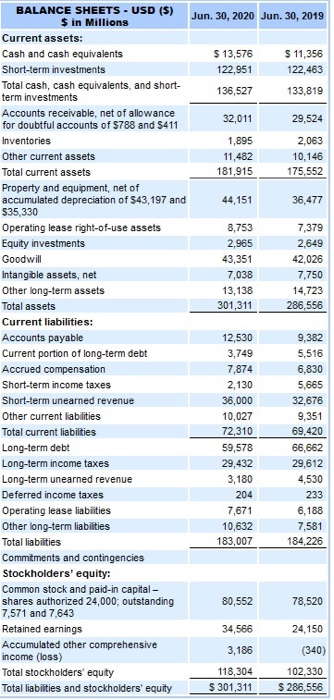
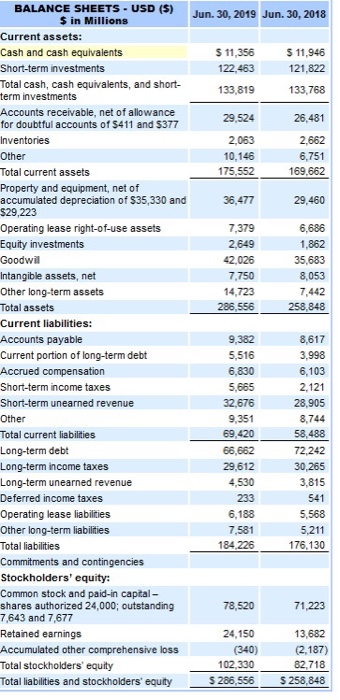
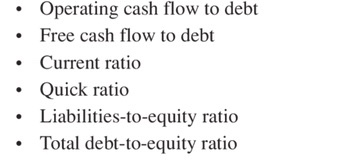
INCOME STATEMENTS - USD (5) 12 Months Ended shares in Million, 5 in Millione Jun 2020 Jun 30, 2019 Jun 30, 2018 Raven 5140.015 $125 13 51500 Costafree 8095 42.910 38.353 Grossman 98937 82.933 72.007 Research and development 192 18818 14720 16213 17 400 General and native 5.111 4754 Operating income One income nel 77 1416 Income before income 50.00 43.688 414 Provision for income taxes 8.755 48 19.03 144281 39920 N $9.51 Earnings per shares 55.12 55.11 5215 3578 Weighted werage shares 3213 outstanding 7610 7.700 Dited 7.60 7.753 7.794 Product 563.641 Cost of revenue 16.017 5.273 13.420 Service and Other 74314 58.74 45363 Cost of revenue 530001 522.00 I afects the 197 milion et charpented the enactment of the TCJA for the second quarter and the $26 bilion net income tax benefited to the property refers for the fourth or which together increased net income by 824 bilion recapear 2018 See Note 12-Income Taxes for further information Afects the rechargerited to the actment of the TCM and the net income tax brett related to the interible property, which decreed Crediled EPS for the second quare for the fourth arter and S03) for fiscal year 2018 16 Menu of sheer CASH FLOWS STATEMENTS 12 Months Ended USD 15) Sin Millions Jun 30, 2020 Jun 30, 2019 Jan. 20.20 Operations Netice 339240 Adjustments to reconcile net 3 16.571 income to net cash from operations Depreciation, and other 12. 11 10.200 Stock band compensation expense 42 Met record in one and 219 2.212 11 05.143) Changes in operating assets and abiti (2,577) 2,812) . SOT 2,3301 (1.710 (1037) Accueil 3018 2212 5.822 ncome taxes 361 2.909 15,183 Other currentes 1340 1419 1 343 501 60025 431354 matures of days or loss, (7.324) Proceeds from suce et Cash on debt exchange 7,183 O Repayment of dett 15518 14.000 (10.060) Common stock issued 1,002 Common stock repurchased (19.545 (10 721) Common stock cash dividends pad (15.137 (131) (575 1971) Netch used in Marche 480 (36,887) Additions to property and equipment (13.925 Acquisition of companies, net af cash (116) ured, and purchases of intangible 2. and others (77.1901 (137.300) of vete 66440 20043 26.00 17.221 IN 117,577 (1.241) 0 1900 Net cash used in investing (15.731 8061 Efect of foreign exchanges och (2013 (115) 50 2.220 4233 Cand can het begongo 11.06 7,683 $13.578 $11.366 $11.9 IN Perfects the 3187 milion et charpe related to enter of the TCJA for the second quarter and the 126 bilione income tax bertere related to the interibile property transfers for the fourth quarter which together increased set income by 24 bution to focal year 2018 See Mote 12-Income Tres for Burther information BALANCE SHEETS - USD ($) $ in Millions Jun 30, 2020 Jun 30, 2019 Current assets: Cash and cash equivalents $ 13,576 $ 11,356 Short-term investments 122,951 122,463 Total cash, cash equivalents, and short- 136,527 133,819 term investments Accounts receivable, net of allowance 32,011 29,524 for doubtful accounts of $788 and 5411 Inventories 1,895 2,063 Other current assets 11,482 10,146 Total current assets 181,915 175,552 Property and equipment, net of accumulated depreciation of 543,197 and 44,151 36,477 $35,330 Operating lease right-of-use assets 8,753 7,379 Equity investments 2,965 2,649 Goodwill 43,351 42,026 Intangible assets, net 7,038 7,750 Other long-term assets 13,138 14,723 Total assets 301,311 286,556 Current liabilities: Accounts payable 12,530 9,382 Current portion of long-term debt 3,749 5,516 Accrued compensation 7,874 6,830 Short-term income taxes 2,130 5,665 Short-term unearned revenue 36,000 32,676 Other current liabilities 10,027 9,351 Total current liabilities 72,310 69,420 Long-term debt 59,578 66,662 Long-term income taxes 29,432 29,612 Long-term unearned revenue 3,180 4,530 Deferred income taxes 204 233 Operating lease liabiities 7,671 6,188 Other long-term liabilities 10,632 7,581 Total liabilities 183,007 184,226 Commitments and contingencies Stockholders' equity: Common stock and paid-in capital shares authorized 24,000, outstanding 80,552 78,520 7,571 and 7.643 Retained earnings 34,566 24,150 Accumulated other comprehensive 3,186 (340) income (loss) Total stockholders' equity 118,304 102,330 Total liabilities and stockholders' equity $ 301,311 $ 286,556 Jun 30, 2019 Jun 30, 2018 $ 11,356 122.463 133,819 $ 11,946 121,822 133,768 29,524 26,481 2,063 10,146 175,552 2,662 6,751 169,662 36,477 29,460 7.379 2,649 42,026 7,750 14,723 286,556 6,686 1,862 35,683 8,053 7,442 258,848 BALANCE SHEETS - USD (5) $ in Millions Current assets: Cash and cash equivalents Short-term investments Total cash, cash equivalents, and short- term investments Accounts receivable, net of allowance for doubtful accounts of 5411 and $377 Inventories Other Total current assets Property and equipment, net of accumulated depreciation of $35,330 and $29,223 Operating lease right-of-use assets Equity investments Goodwil Intangible assets, net Other long-term assets Total assets Current liabilities: Accounts payable Current portion of long-term debt Accrued compensation Short-term income taxes Short-term unearned revenue Other Total current liabilities Long-term debt Long-term income taxes Long-term unearned revenue Deferred income taxes Operating lease liabilities Other long-term liabilities Total liabilities Commitments and contingencies Stockholders' equity: Common stock and paid-in capital - shares authorized 24,000; outstanding 7,643 and 7,677 Retained earnings Accumulated other comprehensive loss Total stockholders' equity Total liabilities and stockholders' equity 9,382 5,516 6,830 5,665 32,676 9,351 69,420 66,662 29,612 4,530 233 6,188 7.581 184.226 8,617 3,998 6,103 2,121 28,905 8,744 58,488 72.242 30,265 3,815 541 5,568 5,211 176,130 78,520 71,223 24,150 (340) 102,330 $ 286,556 13,682 (2,187) 82,718 $ 258,848 . 3. Extend the analysis by computing the following ratios for the current and prior years for the company(ies). (As- sume a marginal tax rate of 22%.) Return on equity (ROE) Return on assets (ROA) Return on net operating assets (RNOA) Times interest earned . . . Operating cash flow to debt Free cash flow to debt Current ratio Quick ratio Liabilities-to-equity ratio Total debt-to-equity ratio
