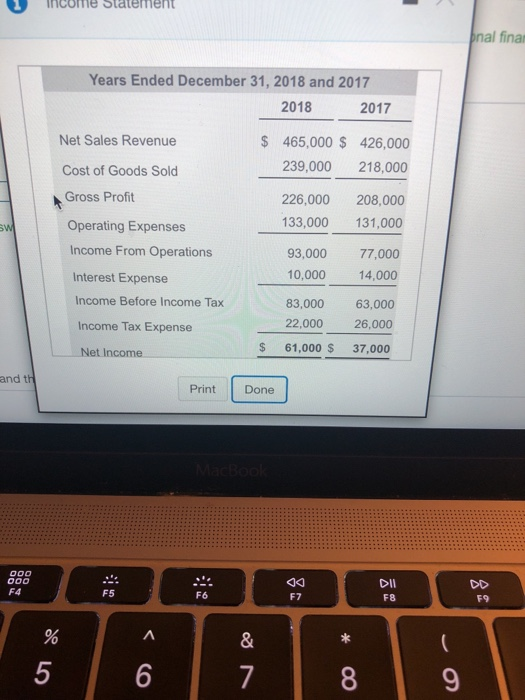
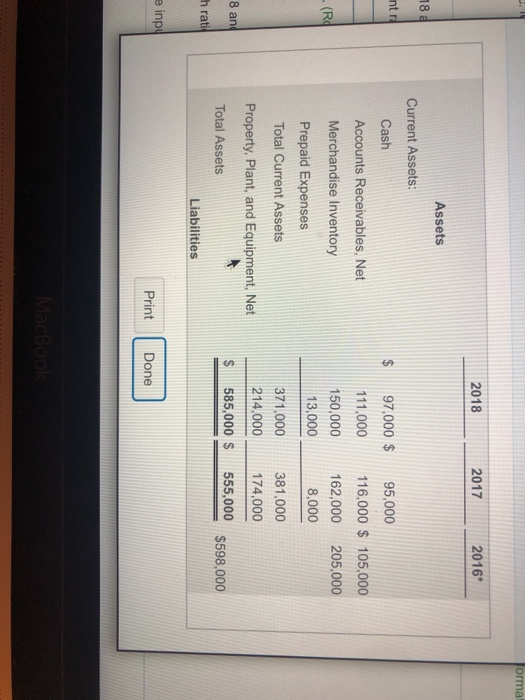
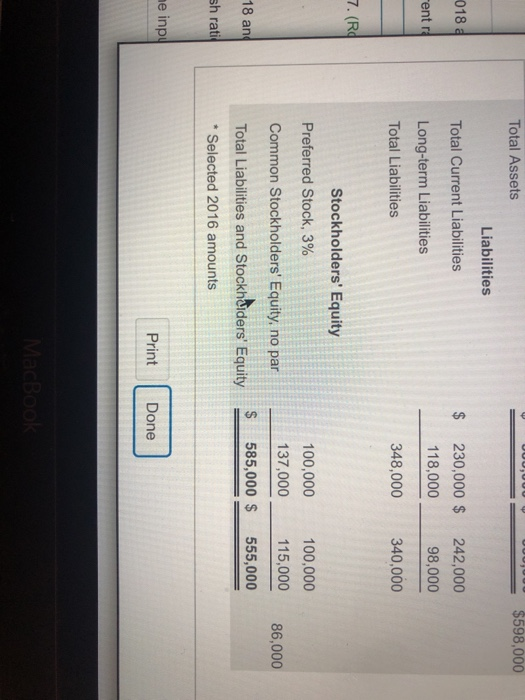
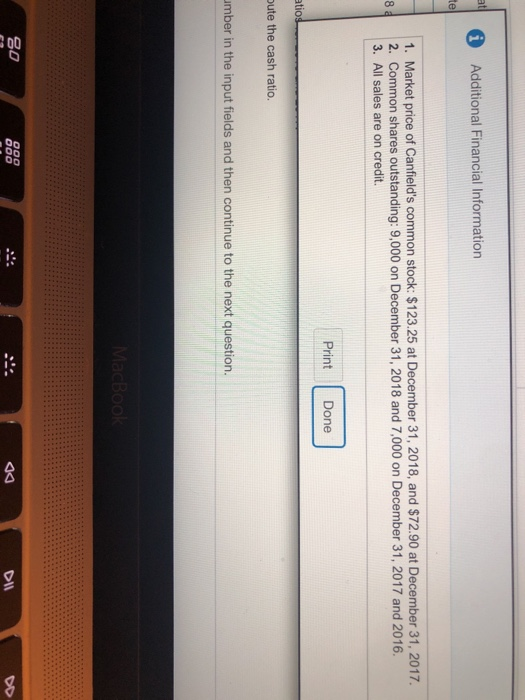
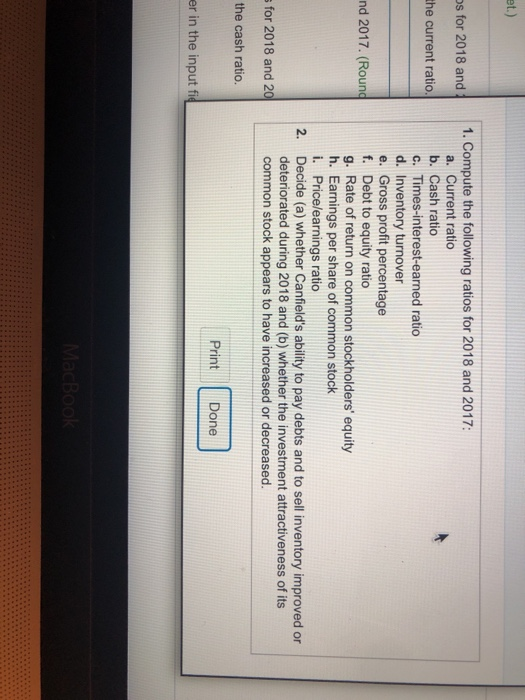
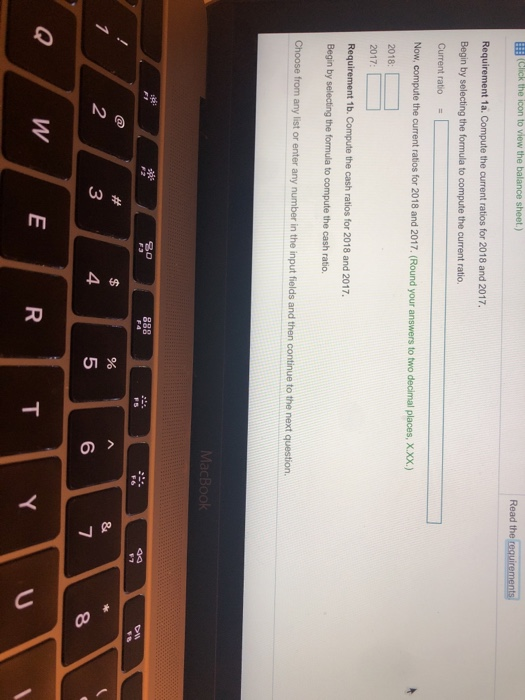
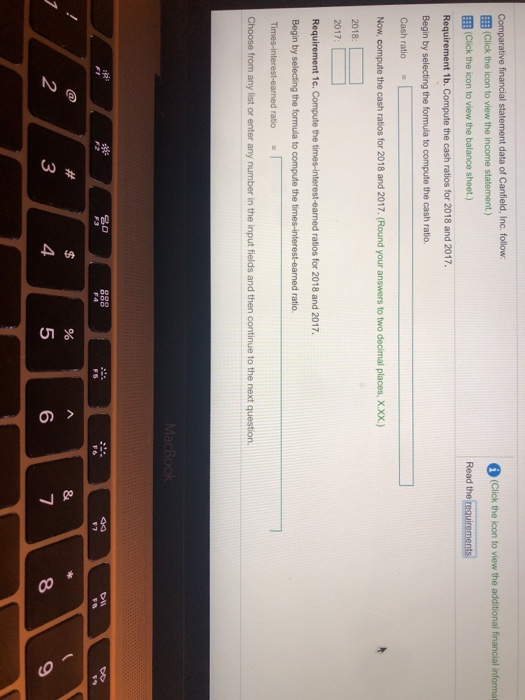
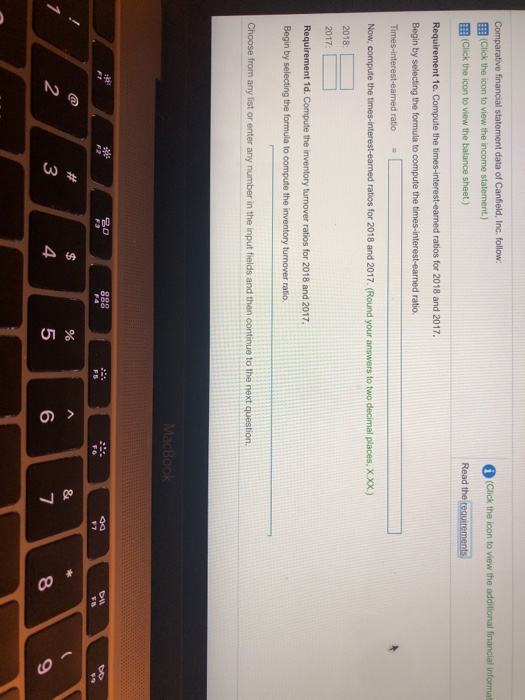
incorme Staterment nal finar Years Ended December 31, 2018 and 2017 2018 2017 Net Sales Revenue $ 465,000 $ 426,000 239,000 218,000 226,000 208,000 133,000 131,000 93,000 77,000 Cost of Goods Sold Gross Profit Operating Expenses Income From Operations nterest Expense 0,000 14,000 83,000 63,000 22,000 26,000 S 61,000 S 37.000 Income Before Income Tax ncome Tax Expense Net Income Print Done F4 F5 F6 F7 F8 F9 5 6 8 orma 2016 2017 2018 Assets 18 Current Assets: nt r $ 97.000 $ 95,000 Cash Accounts Receivables, Net Merchandise Inventory Prepaid Expenses Total Current Assets 111000 116,000 $ 105.000 150,000 162,000 205,000 (R 8,000 371,000 381,000 214,000174,000 S 585,000 $ 555,000 13,000 Property, Plant, and Equipment, Net 8 an Total Assets $598,000 h rati Liabilities e inp Print Done $598,000 Total Assets Liabilities 230,000 242,000 98,000 348,000 340,000 018 Total Current Liabilities Long-term Liabilities Total Liabilities 118,000 ent r 7. (R Stockholders' Equity 100,000 137,000 100,000 115,000 86,000 Preferred Stock, 3% Common Stockholders' Equity, no par Total Liabilities and Stockhoiders Equity Selected 2016 amounts S 585,000 $ 555,000 18 an sh rati Print Done Additional Financial Information 1. Market price of Canfield's common stock: $123.25 at December 31, 2018, and $72.90 at December 31, 2017. 2. Common shares outstanding: 9,000 on December 31, 2018 and 7,000 on December 31, 2017 and 2016. 3. All sales are on credit. Print Done atio ute the cash ratio. mber in the input fields and then continue to the next question. 0 DIl et.) 1. Compute the following ratios for 2018 and 2017 s for 2018 and a. Current ratio b. Cash ratio c. Times-interest-earned ratio d. Inventory turnover e. Gross profit percentage f. Debt to equity ratio g. Rate of return on common stockholders equity h. Earnings per share of common stock i. Pricelearnings ratio Decide (a) whether Canfield's ability to pay debts and to sell inventory improved or deteriorated during 2018 and (b) whether the investment attractiveness of its common stock appears to have increased or decreased. the current ratio nd 2017. (Round 2. sfor 2018 and 20 the cash ratio. Print Done er in the input fi Click the icon to view the balance sheet.) Requirement 1a. Compute the current ratios for 2018 and 2017 Begin by selecting the formula to compute the current ratio Current ratio Now, compute the current ratios for 2018 and 2017. (Round your answers to two decimal places, x.Xx.) 2018 2017: Requirement 1b. Compute the cash ratios for 2018 and 2017. Begin by selecting the formula to compute the cash ratio. Choose from any list or enter any number in the input fields and then continue to the next question. 6 2 3 4 tive financial statement data of Canfield, Inc. follow: Click the icon to view the additional financial informat (click the icon to view the income statement) EB (Click the icon to view the balance sheet.) Requirement 1b. Compute the cash ratios for 2018 and 2017 Begin by selecting the formula to compute the cash ratio. Cash ratio Now, compute the cash ratios for 2018 and 2017. (Round your answers to two decimal places, X.xx.) 2018: Read the rea Requirement 1c. Compute the times-interest-eamed ratios for 2018 and 2017 Begin by selecting the formula to compute the times-interest-earned ratio. ratio Choose from any list or enter any number in the input fields and then continue to the next question 4 7 2 3 6 Comparative financial statement data of Canfield, Inc. follow: Click the icon to view the (Click the icon to view the income statement.) EE (Click the icon to view the balance sheet.) Requirement 1c. Compute the times-interest-eaned ratios for 2018 and 2017. Begin by selecting the formula to compute the times-interest-earned ratio. Read the requirements Now, compute the times-interest-eaned ratios for 2018 and 2017. (Round your answers to two decimal places, XXX.) 2018: 2017 Requirement 1d. Compute the inventory turnover ratios for 2018 and 2017 Choose from any list or enter any number in the input fields and then continue to the next question. 0 49 2 3 6
