Answered step by step
Verified Expert Solution
Question
1 Approved Answer
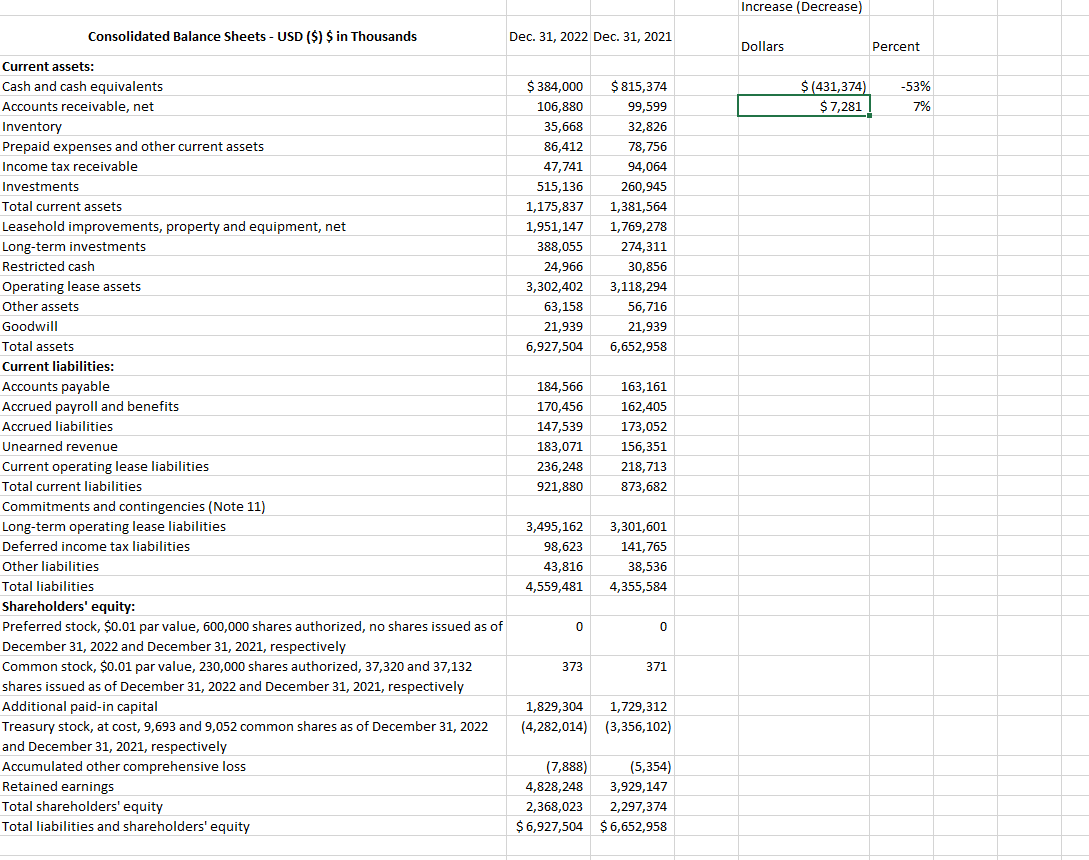
Increase (Decrease) Accounts receivable, net Consolidated Balance Sheets - USD ($) $ in Thousands Dec. 31, 2022 Dec. 31, 2021 Dollars Percent Current assets:


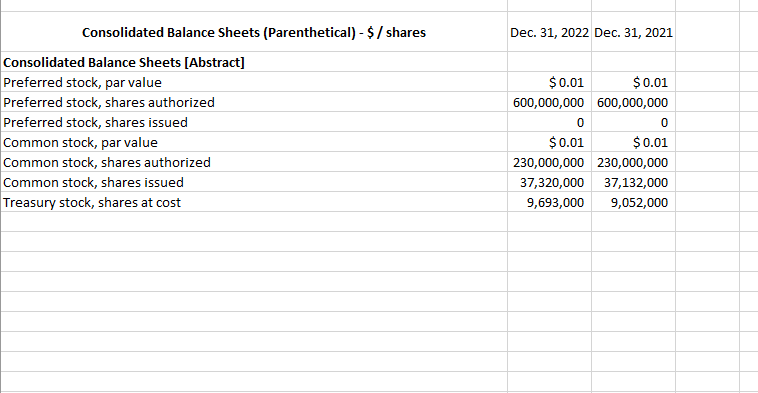
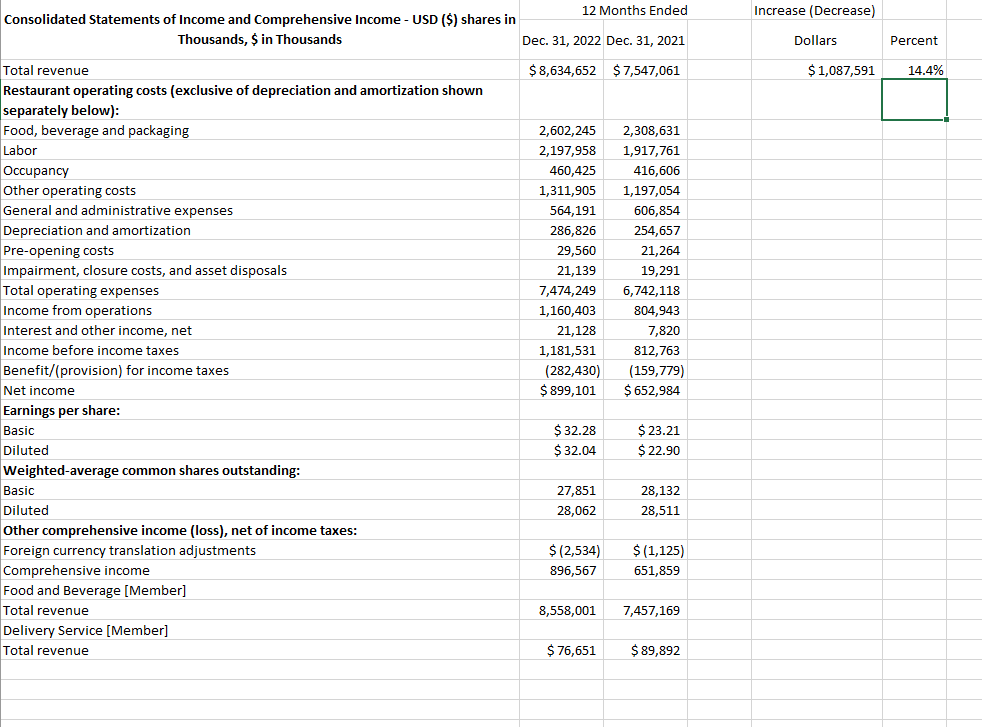
Increase (Decrease) Accounts receivable, net Consolidated Balance Sheets - USD ($) $ in Thousands Dec. 31, 2022 Dec. 31, 2021 Dollars Percent Current assets: Cash and cash equivalents $(431,374) $7,281 -53% 7% $384,000 $815,374 106,880 99,599 Inventory 35,668 32,826 Prepaid expenses and other current assets 86,412 78,756 Income tax receivable 47,741 94,064 Investments 515,136 260,945 Total current assets 1,175,837 1,381,564 Leasehold improvements, property and equipment, net 1,951,147 1,769,278 Long-term investments 388,055 274,311 Restricted cash 24,966 30,856 Operating lease assets 3,302,402 3,118,294 Other assets Goodwill 63,158 21,939 56,716 21,939 Total assets Current liabilities: Accounts payable Accrued payroll and benefits Accrued liabilities Unearned revenue 6,927,504 6,652,958 184,566 163,161 170,456 162,405 147,539 173,052 183,071 156,351 Current operating lease liabilities Total current liabilities 236,248 218,713 921,880 873,682 Commitments and contingencies (Note 11) Long-term operating lease liabilities Deferred income tax liabilities Other liabilities Total liabilities 3,495,162 3,301,601 98,623 141,765 43,816 38,536 4,559,481 4,355,584 Shareholders' equity: Preferred stock, $0.01 par value, 600,000 shares authorized, no shares issued as of December 31, 2022 and December 31, 2021, respectively Common stock, $0.01 par value, 230,000 shares authorized, 37,320 and 37,132 shares issued as of December 31, 2022 and December 31, 2021, respectively Additional paid-in capital 0 0 373 371 Treasury stock, at cost, 9,693 and 9,052 common shares as of December 31, 2022 and December 31, 2021, respectively Accumulated other comprehensive loss Retained earnings Total shareholders' equity Total liabilities and shareholders' equity 1,829,304 1,729,312 (4,282,014) (3,356,102) (7,888) 4,828,248 (5,354) 3,929,147 2,368,023 2,297,374 $6,927,504 $6,652,958 Consolidated Balance Sheets (Parenthetical) - $/shares Consolidated Balance Sheets [Abstract] Preferred stock, shares authorized Preferred stock, par value Preferred stock, shares issued Common stock, par value Common stock, shares authorized Common stock, shares issued Treasury stock, shares at cost Dec. 31, 2022 Dec. 31, 2021 $0.01 $0.01 600,000,000 600,000,000 0 0 $0.01 $0.01 230,000,000 230,000,000 37,320,000 37,132,000 9,693,000 9,052,000 Consolidated Statements of Income and Comprehensive Income - USD ($) shares in Thousands, $ in Thousands Total revenue Restaurant operating costs (exclusive of depreciation and amortization shown 12 Months Ended Dec. 31, 2022 Dec. 31, 2021 $8,634,652 $7,547,061 Increase (Decrease) Dollars Percent $1,087,591 14.4% separately below): Food, beverage and packaging Labor 2,602,245 2,308,631 2,197,958 1,917,761 Occupancy 460,425 416,606 Other operating costs 1,311,905 1,197,054 General and administrative expenses 564,191 606,854 Depreciation and amortization 286,826 254,657 Pre-opening costs 29,560 21,264 Impairment, closure costs, and asset disposals 21,139 19,291 Total operating expenses 7,474,249 6,742,118 Income from operations 1,160,403 804,943 Interest and other income, net 21,128 7,820 Income before income taxes 1,181,531 812,763 Benefit/(provision) for income taxes Net income Earnings per share: Basic (282,430) (159,779) $899,101 $652,984 $32.28 $23.21 Diluted $32.04 $22.90 Weighted-average common shares outstanding: Basic 27,851 28,132 Diluted 28,062 28,511 Other comprehensive income (loss), net of income taxes: Foreign currency translation adjustments $ (2,534) Comprehensive income 896,567 $ (1,125) 651,859 Food and Beverage [Member] Total revenue Delivery Service [Member] Total revenue 8,558,001 7,457,169 $ 76,651 $89,892
Step by Step Solution
There are 3 Steps involved in it
Step: 1

Get Instant Access to Expert-Tailored Solutions
See step-by-step solutions with expert insights and AI powered tools for academic success
Step: 2

Step: 3

Ace Your Homework with AI
Get the answers you need in no time with our AI-driven, step-by-step assistance
Get Started


