

Answered step by step
Verified Expert Solution
Question
1 Approved Answer
Increase/decrease Please also show the graph change The following graph depicts the foreign exchange market for euros. The blue line represents the demand schedule for
Increase/decrease
Please also show the graph change
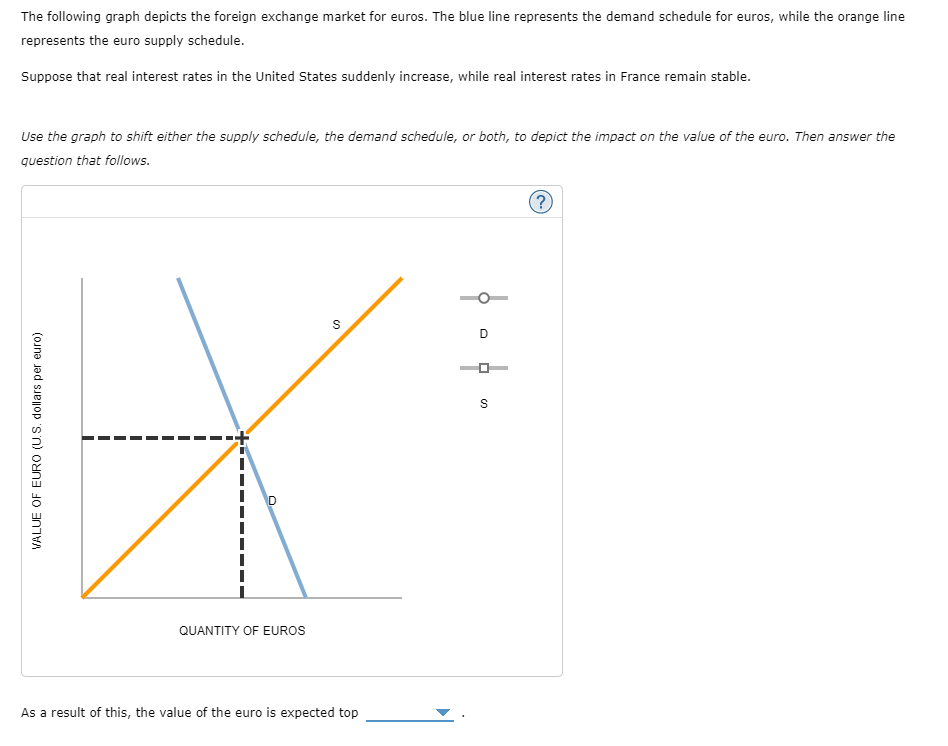
The following graph depicts the foreign exchange market for euros. The blue line represents the demand schedule for euros, while the orange line represents the euro supply schedule. Suppose that real interest rates in the United States suddenly increase, while real interest rates in France remain stable. Use the graph to shift either the supply schedule, the demand schedule, or both, to depict the impact on the value of the euro. Then answer the question that follows. ? S D ) S VALUE OF EURO (U.S. dollars per euro) D QUANTITY OF EUROS As a result of this, the value of the euro is expected topStep by Step Solution
There are 3 Steps involved in it
Step: 1

Get Instant Access to Expert-Tailored Solutions
See step-by-step solutions with expert insights and AI powered tools for academic success
Step: 2

Step: 3
Ace Your Homework with AI
Get the answers you need in no time with our AI-driven, step-by-step assistance
Get Started
Contemporary Economics An Applications Approach
Authors: Robert Carbaugh
8th Edition
1138652199, 978-1138652194