

Question
Indicate your response here. In your first paragraph, introduce the subject matter of your report, identify the data set you used, and provide a brief
Indicate your response here. In your first paragraph, introduce the subject matter of your report, identify the data set you used, and provide a brief summary of your experiences and results in creating and executing the functions in Codio. Use tables whenever you are including statistics and paragraphs and you are explaining their significance.Include all relevant citations in APA format (Author last name, Date). If you need to include a graph, include the image in a one-cell table, as follows:
Diagram
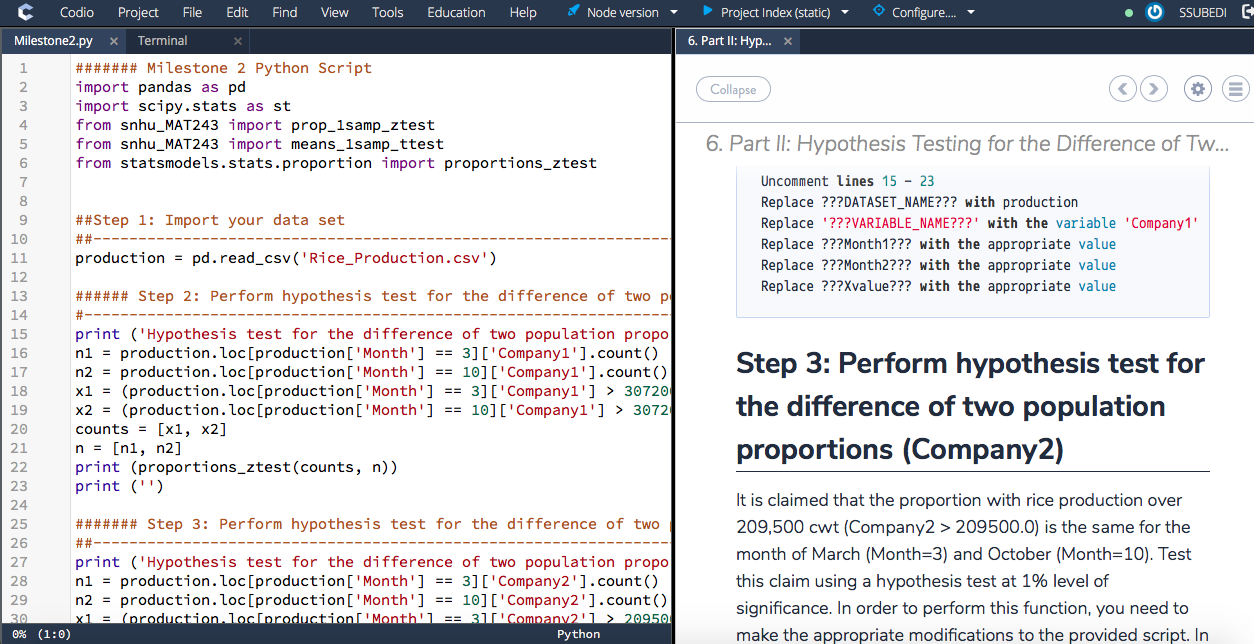
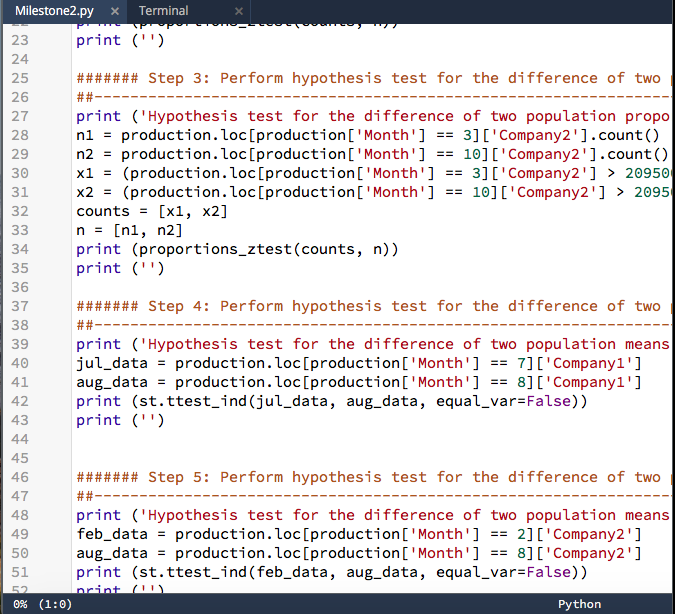
In your body paragraph(s), explain the importance of hypothesis tests and how they can be used in estimating population parameters. Illustrate the critical parameters that you employed in creating your Python script in Codio. Specify each and explain their importance for performing the hypothesis tests. Specifically, address each of the following: the null hypothesis, alternative hypothesis, level of significance, and associated critical value(s) for the hypothesis test. Identify the variable you used to perform the hypothesis test and the Python functions you used in your Python script in Codio. Use a table to include the test statistic and the probability value followed by paragraphs explaining their relevance. The table should look as follows:
Statistics
Value
Test Statistic
9.9999 (Remember to round off to appropriate decimal places.)
Probability Value
0.9999 (Remember to round off to appropriate decimal places.)
Table
In your final paragraph(s), interpret the results of your analyses in terms of their statistical significance. Specifically, be sure to address the test statistic and the probability value of the hypothesis tests. Summarize the results of your statistical analyses and clearly communicate the ideas by translating relevant course concepts and terminology into plain language. Include all relevant citations in APA format (Author last name, Date).
References
Zybooks. (2016).Statistics with Python. Los Gatos, CA: Zybooks.
Make sure that you provide appropriate in-text citations in APA style, with the author's name and year of publication (Author last name, year). The textbook above is provided as an example and should be kept in the references section of this paper. Feel free to add other resources. To add credibility to your paper, remember to citeALLof the sources within the body of the paper, as well as in the References section at the end. References should be in alphabetical order by the author's last name.
Step by Step Solution
There are 3 Steps involved in it
Step: 1

Get Instant Access to Expert-Tailored Solutions
See step-by-step solutions with expert insights and AI powered tools for academic success
Step: 2

Step: 3
Ace Your Homework with AI
Get the answers you need in no time with our AI-driven, step-by-step assistance
Get Started
Algebra 2
Authors: Randall I. Charles, Basia Hall, Dan Kennedy, Laurie E Bass
Student Edition
0133500438, 978-0133500431