Answered step by step
Verified Expert Solution
Link Copied!

Question

1 Approved Answer

Individual Project I. Standard scores & Correlation (all the data tables: 13 students only & using avg as X) Name Rank X(observed scores of test:
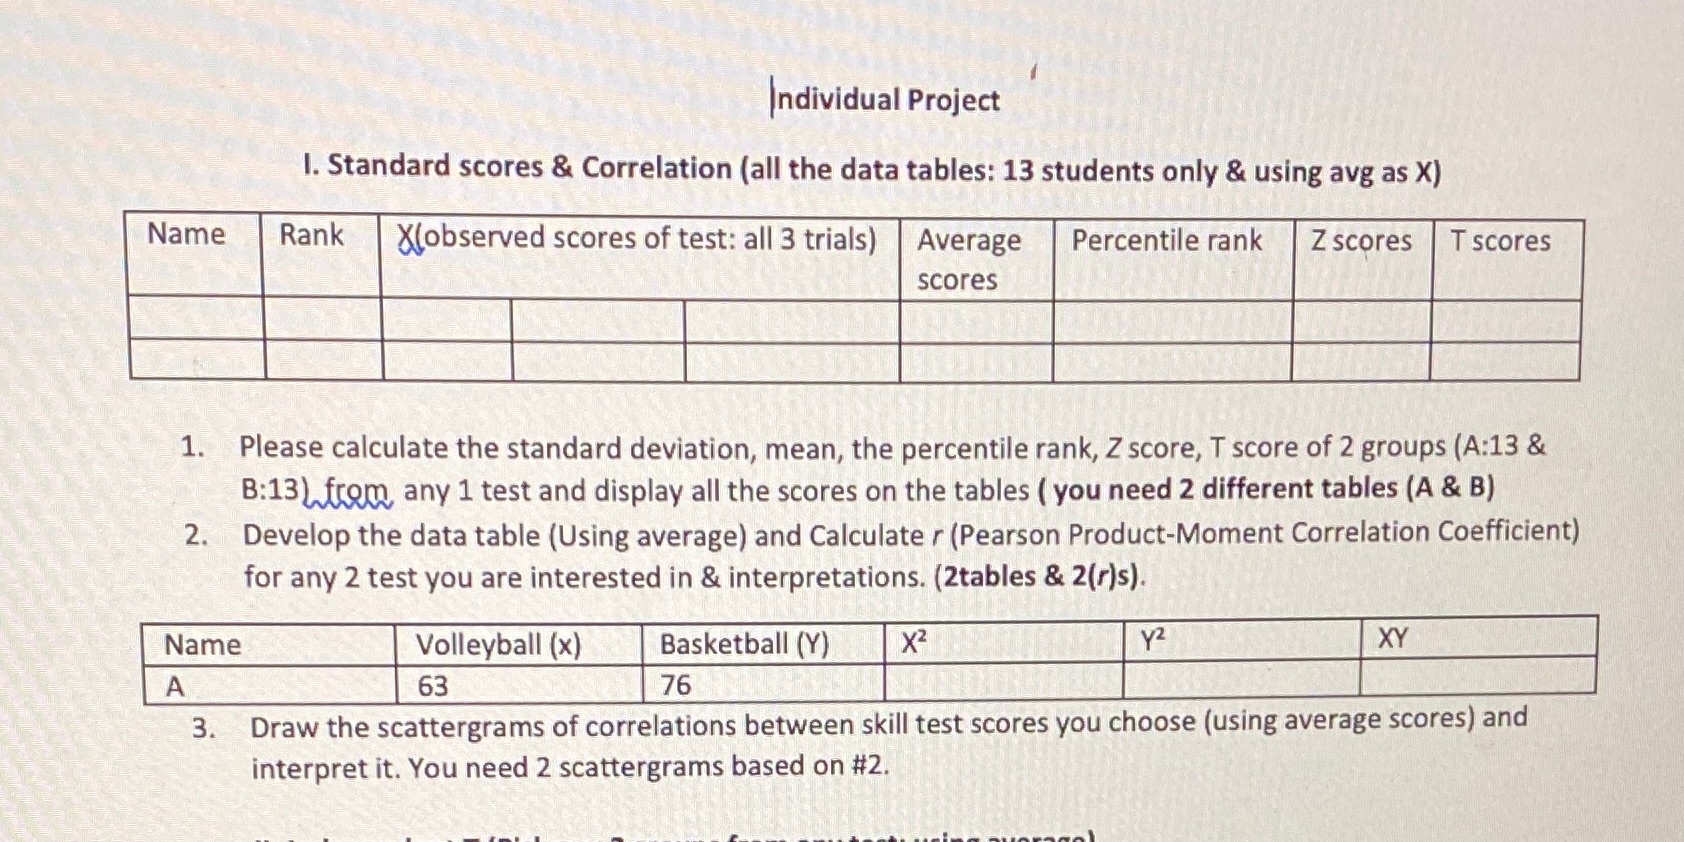
image text in transcribed
Individual Project I. Standard scores & Correlation (all the data tables: 13 students only & using avg as X) Name Rank X(observed scores of test: all 3 trials) Average Percentile rank Z scores T scores scores 1. Please calculate the standard deviation, mean, the percentile rank, Z score, T score of 2 groups (A:13 & B:13) from any 1 test and display all the scores on the tables ( you need 2 different tables (A & B) 2. Develop the data table (Using average) and Calculate r (Pearson Product-Moment Correlation Coefficient) for any 2 test you are interested in & interpretations. (2tables & 2(r)s). Name Volleyball (x) Basketball (Y) X2 Yz XY A 63 76 3. Draw the scattergrams of correlations between skill test scores you choose (using average scores) and interpret it. You need 2 scattergrams based on #2

Step by Step Solution

There are 3 Steps involved in it

Step: 1

blur-text-image

Get Instant Access to Expert-Tailored Solutions

See step-by-step solutions with expert insights and AI powered tools for academic success

Step: 2

blur-text-image

Step: 3

blur-text-image

Ace Your Homework with AI

Get the answers you need in no time with our AI-driven, step-by-step assistance

Get Started

Recommended Textbook for

Algebra And Trigonometry

Authors: Cynthia Y Young

3rd Edition

1118475755, 9781118475751

More Books

Students also viewed these Mathematics questions

Question

Discuss the key people management challenges that Dorian faced.

Answered: 1 week ago

Question

How fast should bidder managers move into the target?

Answered: 1 week ago