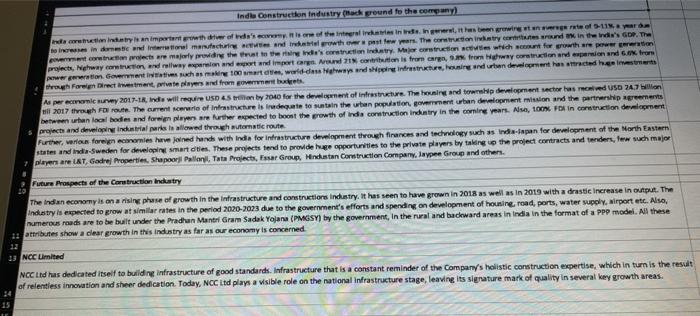
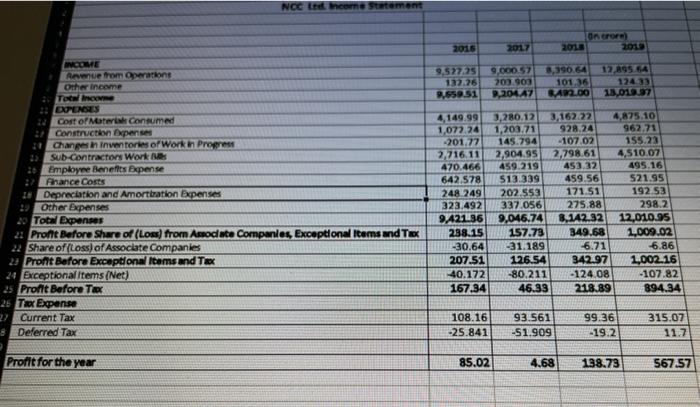
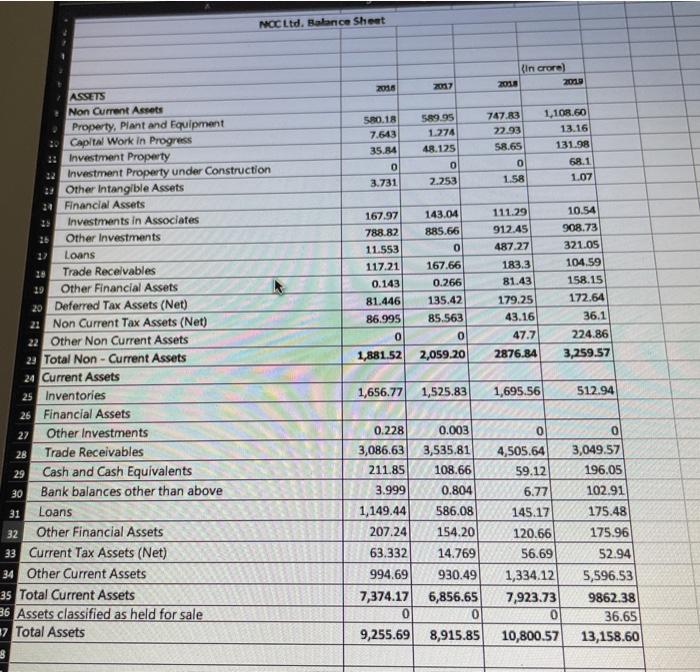
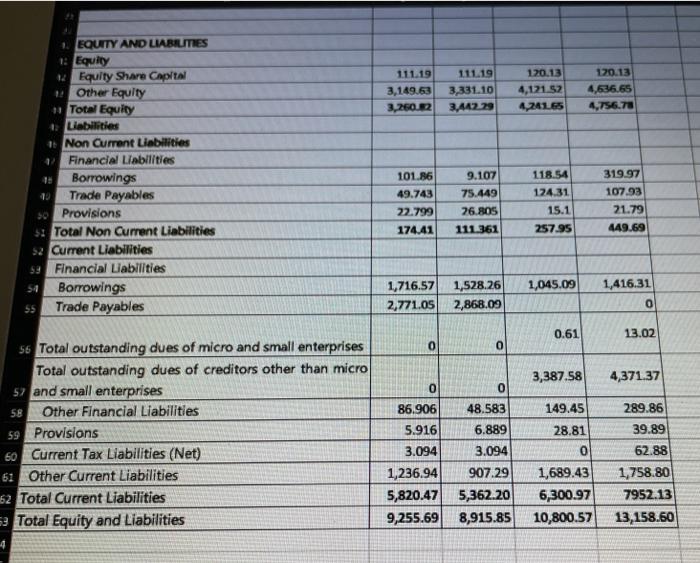
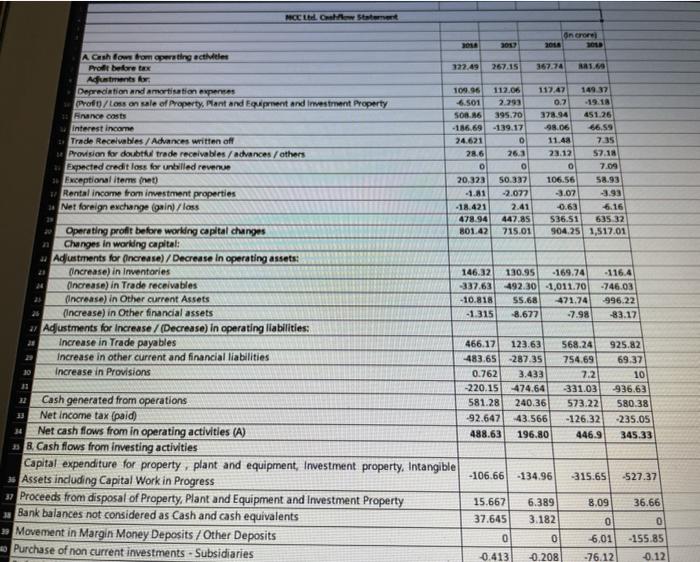
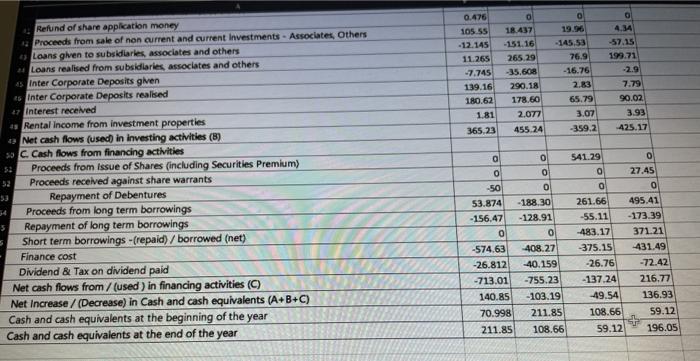
Indle Construction industry (hack ground to the company dainty is an important rowth of we're of the interesinden testing of -11% yard to increase in the end Infowl marcturing and terwth post few years. The construction interesse in the de's GDP. The corrects are merly in the east to the destruction et Mertruction which for growth are power to projects, Nighway com drowny parin and and importar Aron is from ear, from any od prin and from pwerewo Government is such as making 100 arts, world das ward shipping interestruktur, honing and urban devlet has acted himester through Foreign Directement te payers and from var Aspectomie kurvey 2017-1, Inde will require USD 45 by 2040 for the development of indestructure. The housing and to development sector has med USD 247 2017 through Foruter. The current write of infrastructure is rate to sustain the han population grant Urban elment mission and the partnership perts between han acal bodies and foreign players are therected to boost the growth of india construction Industry in the coming years. Nisa, 100 F Incotruction development projects and developing indenstriali e allowed through automatic route Further, er foreign mies have joined hands with India for infrastructure development through frances and tewey such as India-iapan for development of the North Eastern states and indie-Sweden for developing smart oties. These projects tend to provide huge opportunities to the private players by taking the project contracts and tenders, few such major players are LST, Godrej Properties. Shapoor Pallonil Tata Projects, Essar Group, Hindustan Construction Company, laypee Group and others Future Prospects of the Carstruction Industry The Indian economy is on arising phase of growth in the infrastructure and constructions industry. It has seen to have grown in 2018 as well as in 2019 with a drastic Increase in output. The industry is expected to grow at similar rates in the period 2020-2023 due to the government's efforts and spending on development of housing, road, ports, water supply, wirport etc. Also, numerous roads are to be built under the Pradhan Mantri Gram Sadak Yojana (PMGSY) by the government in the rural and backward areas in India in the format of a PPP model. All these 20 attributes show a clear growth in this industry as far as our economy is concerned 23 NCC Limited NCC Ltd has dedicated itself to building infrastructure of good standards. Infrastructure that is a constant reminder of the Company's holistic construction expertise, which in turn is the result of relentless innovation and sheer dedication. Today, NCC itd plays a visible role on the national infrastructure stage, leaving its signature mark of quality in several key growth areas. NCC tre come statement On crore 2018 2010 2016 2017 9.527.25 132.26 659151 9.000 57 203.903 9,204.47 8,390.64 12,0956 101.35 12433 N.00 18.01.27 INCOME Anwetom operations Other income Toc 2: DONENSES Cost of Meter consumed : Construction Experise 30 Changes in inwitories of Work in Progress Sub-contractors Works as Employee Benefits Expense Finance costs I Depreciation and Amortation Expenses 12 Other Expenses Total Expenses 2: Pront Before Share of (Loss) from Antodate Companies, Exceptional items and Tax 22 Share of Loss) of Associate Companies 2Pront Before Exceptional Items and Tax 24 Exceptional items (Net) 25 Profit Before Tax 25 Tax Expense 7 Current Tax #Deferred Tax 4,149.99 1,072.24 -201.77 2.716.11 470.466 642.578 248 249 323.492 9.42136 238.15 -30.64 207.51 -40.172 167.34 3,280.12 3,162.22 4,875.10 1,203.71 928.24 962.71 145.794 107.02 155.23 2.904.95 2.798.61 4,510.07 459.219 453.32 495.16 513.339 459.56 521.95 202.553 171.51 192.53 337.056 275.88 298.2 9,046.74 8.142.32 12.010.95 157.73 349.68 1,009.02 -31.189 -6.71 6.86 126.54 342.97 1,002.16 -80.211 -124.08 -107.82 46.33.218.89 894.34 108.16 -25.841 93.561 -51.909 99.36 -19.2 315.07 11.7 Profit for the year 85.02 4.68 138.73 567.57 NOCLtd, Balance Sheet (in crore) 2009 2018 2017 2030 580.18 7.643 35.84 0 3.731 589.95 1.274 48.125 0 2.253 747.83 22.93 58.65 0 1.58 1,108.60 13.16 131.98 68.1 1.07 167.97 788.82 11.553 117.21 0.143 81.446 86.995 0 143.04 885.66 0 167.66 0.266 135.42 85.563 111.29 912.45 487.27 183.3 81.43 179.25 43.16 10.54 908.73 321.05 104.59 158.15 172.64 36.1 224.86 47.7 2876.84 1,881.52 2,059.20 3,259.57 ASSETS Non Current Assets Property, plant and Equipment :. Capital Work in Progress .: Investment Property 22 Investment Property under Construction :: Other Intangible Assets 24 Financial Assets Investments in Associates Other Investments Loans 18 Trade Receivables 29 Other Financial Assets 20 Deferred Tax Assets (Net) 22 Non Current Tax Assets (Net) 22 Other Non Current Assets 23 Total Non - Current Assets 24 Current Assets 25 Inventories 26 Financial Assets 27 Other Investments 28 Trade Receivables 29 Cash and Cash Equivalents 30 Bank balances other than above 31 Loans 32 Other Financial Assets 33 Current Tax Assets (Net) 34 Other Current Assets 35 Total Current Assets 36 Assets classified as held for sale 17 Total Assets 1,656.77 1,525.83 1,695.56 512.94 0 0.228 3,086.63 211.85 3.999 1,149.44 207.24 63.332 994.69 7,374.17 0 9,255.69 0.003 3,535,81 108.66 0.804 586.08 154.20 14.769 930.49 6,856.65 0 8,915.85 4,505.64 59.12 6.77 145.17 120.66 56.69 1,334.12 7,923.73 0 10,800.57 0 3,049.57 196.05 102.91 175.48 175.96 52.94 5,596.53 9862.38 36.65 13,158.60 3 111.19 3,149.53 3,2602 111.19 3,331.10 3,442.79 120.13 4,12152 4.24165 120.13 4,636.65 4,756.78 1. EQUITY AND LIABILMES 1: Equity Equity Share Capital Other Equity ** Total Equity Liabilities # Non Current Liabilities Financial Liabilities Borrowings Trade Payables 50 Provisions 5: Total Non Current Liabilities S2 Current Liabilities 59 Financial Liabilities s Borrowings 55 Trade Payables 101.86 49.743 22.799 174.41 9.107 75.449 26.805 111361 118.54 124.31 15.1 257.95 319.97 107.93 21.79 449.69 1,045.09 1,716.57 1,528.26 2,771.05 2,868.09 1,416.31 0 0.61 13.02 0 0 3,387.58 4,371.37 0 0 149.45 56 Total outstanding dues of micro and small enterprises Total outstanding dues of creditors other than micro 52 and small enterprises 58 Other Financial Liabilities 59 Provisions 60 Current Tax Liabilities (Net) 61 Other Current Liabilities 62 Total Current Liabilities 2 Total Equity and Liabilities 28.81 0 86.906 48.583 5.916 6.889 3.094 3.094 1,236.94 907.29 5,820.47 5,362.20 9,255.69 8,915.85 289.86 39.89 62.88 1,758.80 7952.13 13,158.60 1,689.43 6,300.97 10,800.57 MCCLII. Cal Statement BOLA 2013 On crore 2016 122.49 267.15 367.74 1.60 A Cash fow from operating activities Prodit before tax Aduntments for Depreciation and amortisation permes Profn/Loss on sale of Property, plant and Equipment and investment Property France costs interest income Trade Receivables / Advances written off * Provision for doubtful trade receivables/advances / others Expected credit loss for unbilled revenue * Exceptional items net Rental income from investment properties *Net foreign exchange Comin)/loss 112.06 2.293 395.70 -139.17 0 26.3 109.96 -6.501 SOB.16 -186.69 24.621 28.6 0 20,323 -1.81 -18.421 478.94 801.42 117.47 149 37 0.7 378.94 451.26 98.06 66.59 11.48 7.35 23.12 57.18 0 7.09 106.56 58.93 -3.02 -3.93 0.63 6.16 536.51 635 32 904.25 1,517.01 O 50 337 -2.072 2.41 447.85 715.01 21 Operating profit before working capital changes Changes in worldng capital: - Adjustments for increase) /Decrease in operating assets: Increase) in Inventories Increase) in Trade receivables Increase) in Other current Assets 26 (increase) in Other financial assets ay Adjustments for increase / (Decrease) in operating liabilities: 28 Increase in Trade payables Increase in other current and financial liabilities 10 Increase in Provisions 146.32 -337.63 -10.818 -1.315 130.95 -169.74 492.30 -1,011.70 55.68 471.74 8.677 -7.98 -116.4 -746.03 -996.22 -83.17 466.17 483.65 0.762 -220.15 581.28 -92.647 488.63 123.63 -287.35 3.433 474.64 240.36 43.566 196.80 568.24 754.69 7.2 331.03 573.22 -126.32 446.9 925.82 69.37 10 -936.63 580.38 -235.05 345.33 Cash generated from operations 33 Net Income tax (paid) Net cash flows from in operating activities (A) 23 B. Cash flows from investing activities Capital expenditure for property, plant and equipment, Investment property, Intangible *Assets including Capital Work in Progress 37 Proceeds from disposal of Property, Plant and Equipment and Investment Property Bank balances not considered as Cash and cash equivalents >> Movement in Margin Money Deposits / Other Deposits Purchase of non current investments - Subsidiaries -106.66 134.96 315.65 -527.37 8.09 36.66 15.667 37.645 6.389 3.182 0 0 0 0 6.01 -155.85 0.12 0.413 -0.208 -76.12 0 ola 0.476 105.55 - 12.145 11.265 -7.745 139.16 180.62 1.81 -57.15 199.71 -2.9 18.437 -151.16 265.29 -35.608 290.18 178.60 2.077 -145.53 76.9 -16.76 2.83 65.79 3.07 -359.2 7.79 90.02. 3.93 425.17 365,23 455.24 541.29 0 foto 27.45 Refund of share application money Proceeds from sale of non current and current Investments - Associates Others Loans given to subsidiaries, associates and others 24 Loans realised from subsidiaries, associates and others Inter Corporate Deposits given Inter Corporate Deposits realised 27 Interest received 4* Rental Income from investment properties Net cash flows (used in investing activities (8) * C Cash flows from financing activities Proceeds from issue of Shares (including Securities Premium) Proceeds received against share warrants 33 Repayment of Debentures Proceeds from long term borrowings Repayment of long term borrowings Short term borrowings - (repaid) / borrowed (net) Finance cost Dividend & Tax on dividend paid Net cash flows from / (used) in financing activities (C) Net Increase/ (Decrease) in Cash and cash equivalents (A+B+C) Cash and cash equivalents at the beginning of the year Cash and cash equivalents at the end of the year 0018 -188.30 - 128.91 0 -50 53.874 -156.47 0 -574.63 -26.812 -713.01 140.85 70.998 211.85 -408.27 -40.159 -755.23 -103.19 261.66 495.41 -55.11 -173.39 483.17 371.21 -375.15 431.49 -26.76 -72.42 - 137.24 216.77 49.54 136.93 108.66 59.12 59.12 196.05 211.85 108.66 Q1 Find the three Important factors impact MOC Ltd. ROE? the impact of these factors corner over the three years? Comment on the expected reason for carsteny M Q2 Analyse, NCC Ltd. has been able to manage It's working capital efficiently across the past years from 2016 til 2019). Support your answer with substantive facts and calculations and comment on the same. What working capital polky do you recommend for NCC Ltd. for It's forthcoming years 2020 and 2021? Q3. Looking into the past performance of NOC Ltd., what sales growth percentage do you recommend for the forthcoming years 2020 and 2021. (lustify your choice of using the sales growth for forecasting for years 2020 and 2021 with valid subjective arguments as well) Does NOC Ltd. require AFN for the years 2020 and 2021, yes, then plug in the value with the appropriate source of finandng wested by you for NOC Ltd. 7 Create a Financing Plan for NOC Ltd. and Austify your choice of financing surested for the firm. Indle Construction industry (hack ground to the company dainty is an important rowth of we're of the interesinden testing of -11% yard to increase in the end Infowl marcturing and terwth post few years. The construction interesse in the de's GDP. The corrects are merly in the east to the destruction et Mertruction which for growth are power to projects, Nighway com drowny parin and and importar Aron is from ear, from any od prin and from pwerewo Government is such as making 100 arts, world das ward shipping interestruktur, honing and urban devlet has acted himester through Foreign Directement te payers and from var Aspectomie kurvey 2017-1, Inde will require USD 45 by 2040 for the development of indestructure. The housing and to development sector has med USD 247 2017 through Foruter. The current write of infrastructure is rate to sustain the han population grant Urban elment mission and the partnership perts between han acal bodies and foreign players are therected to boost the growth of india construction Industry in the coming years. Nisa, 100 F Incotruction development projects and developing indenstriali e allowed through automatic route Further, er foreign mies have joined hands with India for infrastructure development through frances and tewey such as India-iapan for development of the North Eastern states and indie-Sweden for developing smart oties. These projects tend to provide huge opportunities to the private players by taking the project contracts and tenders, few such major players are LST, Godrej Properties. Shapoor Pallonil Tata Projects, Essar Group, Hindustan Construction Company, laypee Group and others Future Prospects of the Carstruction Industry The Indian economy is on arising phase of growth in the infrastructure and constructions industry. It has seen to have grown in 2018 as well as in 2019 with a drastic Increase in output. The industry is expected to grow at similar rates in the period 2020-2023 due to the government's efforts and spending on development of housing, road, ports, water supply, wirport etc. Also, numerous roads are to be built under the Pradhan Mantri Gram Sadak Yojana (PMGSY) by the government in the rural and backward areas in India in the format of a PPP model. All these 20 attributes show a clear growth in this industry as far as our economy is concerned 23 NCC Limited NCC Ltd has dedicated itself to building infrastructure of good standards. Infrastructure that is a constant reminder of the Company's holistic construction expertise, which in turn is the result of relentless innovation and sheer dedication. Today, NCC itd plays a visible role on the national infrastructure stage, leaving its signature mark of quality in several key growth areas. NCC tre come statement On crore 2018 2010 2016 2017 9.527.25 132.26 659151 9.000 57 203.903 9,204.47 8,390.64 12,0956 101.35 12433 N.00 18.01.27 INCOME Anwetom operations Other income Toc 2: DONENSES Cost of Meter consumed : Construction Experise 30 Changes in inwitories of Work in Progress Sub-contractors Works as Employee Benefits Expense Finance costs I Depreciation and Amortation Expenses 12 Other Expenses Total Expenses 2: Pront Before Share of (Loss) from Antodate Companies, Exceptional items and Tax 22 Share of Loss) of Associate Companies 2Pront Before Exceptional Items and Tax 24 Exceptional items (Net) 25 Profit Before Tax 25 Tax Expense 7 Current Tax #Deferred Tax 4,149.99 1,072.24 -201.77 2.716.11 470.466 642.578 248 249 323.492 9.42136 238.15 -30.64 207.51 -40.172 167.34 3,280.12 3,162.22 4,875.10 1,203.71 928.24 962.71 145.794 107.02 155.23 2.904.95 2.798.61 4,510.07 459.219 453.32 495.16 513.339 459.56 521.95 202.553 171.51 192.53 337.056 275.88 298.2 9,046.74 8.142.32 12.010.95 157.73 349.68 1,009.02 -31.189 -6.71 6.86 126.54 342.97 1,002.16 -80.211 -124.08 -107.82 46.33.218.89 894.34 108.16 -25.841 93.561 -51.909 99.36 -19.2 315.07 11.7 Profit for the year 85.02 4.68 138.73 567.57 NOCLtd, Balance Sheet (in crore) 2009 2018 2017 2030 580.18 7.643 35.84 0 3.731 589.95 1.274 48.125 0 2.253 747.83 22.93 58.65 0 1.58 1,108.60 13.16 131.98 68.1 1.07 167.97 788.82 11.553 117.21 0.143 81.446 86.995 0 143.04 885.66 0 167.66 0.266 135.42 85.563 111.29 912.45 487.27 183.3 81.43 179.25 43.16 10.54 908.73 321.05 104.59 158.15 172.64 36.1 224.86 47.7 2876.84 1,881.52 2,059.20 3,259.57 ASSETS Non Current Assets Property, plant and Equipment :. Capital Work in Progress .: Investment Property 22 Investment Property under Construction :: Other Intangible Assets 24 Financial Assets Investments in Associates Other Investments Loans 18 Trade Receivables 29 Other Financial Assets 20 Deferred Tax Assets (Net) 22 Non Current Tax Assets (Net) 22 Other Non Current Assets 23 Total Non - Current Assets 24 Current Assets 25 Inventories 26 Financial Assets 27 Other Investments 28 Trade Receivables 29 Cash and Cash Equivalents 30 Bank balances other than above 31 Loans 32 Other Financial Assets 33 Current Tax Assets (Net) 34 Other Current Assets 35 Total Current Assets 36 Assets classified as held for sale 17 Total Assets 1,656.77 1,525.83 1,695.56 512.94 0 0.228 3,086.63 211.85 3.999 1,149.44 207.24 63.332 994.69 7,374.17 0 9,255.69 0.003 3,535,81 108.66 0.804 586.08 154.20 14.769 930.49 6,856.65 0 8,915.85 4,505.64 59.12 6.77 145.17 120.66 56.69 1,334.12 7,923.73 0 10,800.57 0 3,049.57 196.05 102.91 175.48 175.96 52.94 5,596.53 9862.38 36.65 13,158.60 3 111.19 3,149.53 3,2602 111.19 3,331.10 3,442.79 120.13 4,12152 4.24165 120.13 4,636.65 4,756.78 1. EQUITY AND LIABILMES 1: Equity Equity Share Capital Other Equity ** Total Equity Liabilities # Non Current Liabilities Financial Liabilities Borrowings Trade Payables 50 Provisions 5: Total Non Current Liabilities S2 Current Liabilities 59 Financial Liabilities s Borrowings 55 Trade Payables 101.86 49.743 22.799 174.41 9.107 75.449 26.805 111361 118.54 124.31 15.1 257.95 319.97 107.93 21.79 449.69 1,045.09 1,716.57 1,528.26 2,771.05 2,868.09 1,416.31 0 0.61 13.02 0 0 3,387.58 4,371.37 0 0 149.45 56 Total outstanding dues of micro and small enterprises Total outstanding dues of creditors other than micro 52 and small enterprises 58 Other Financial Liabilities 59 Provisions 60 Current Tax Liabilities (Net) 61 Other Current Liabilities 62 Total Current Liabilities 2 Total Equity and Liabilities 28.81 0 86.906 48.583 5.916 6.889 3.094 3.094 1,236.94 907.29 5,820.47 5,362.20 9,255.69 8,915.85 289.86 39.89 62.88 1,758.80 7952.13 13,158.60 1,689.43 6,300.97 10,800.57 MCCLII. Cal Statement BOLA 2013 On crore 2016 122.49 267.15 367.74 1.60 A Cash fow from operating activities Prodit before tax Aduntments for Depreciation and amortisation permes Profn/Loss on sale of Property, plant and Equipment and investment Property France costs interest income Trade Receivables / Advances written off * Provision for doubtful trade receivables/advances / others Expected credit loss for unbilled revenue * Exceptional items net Rental income from investment properties *Net foreign exchange Comin)/loss 112.06 2.293 395.70 -139.17 0 26.3 109.96 -6.501 SOB.16 -186.69 24.621 28.6 0 20,323 -1.81 -18.421 478.94 801.42 117.47 149 37 0.7 378.94 451.26 98.06 66.59 11.48 7.35 23.12 57.18 0 7.09 106.56 58.93 -3.02 -3.93 0.63 6.16 536.51 635 32 904.25 1,517.01 O 50 337 -2.072 2.41 447.85 715.01 21 Operating profit before working capital changes Changes in worldng capital: - Adjustments for increase) /Decrease in operating assets: Increase) in Inventories Increase) in Trade receivables Increase) in Other current Assets 26 (increase) in Other financial assets ay Adjustments for increase / (Decrease) in operating liabilities: 28 Increase in Trade payables Increase in other current and financial liabilities 10 Increase in Provisions 146.32 -337.63 -10.818 -1.315 130.95 -169.74 492.30 -1,011.70 55.68 471.74 8.677 -7.98 -116.4 -746.03 -996.22 -83.17 466.17 483.65 0.762 -220.15 581.28 -92.647 488.63 123.63 -287.35 3.433 474.64 240.36 43.566 196.80 568.24 754.69 7.2 331.03 573.22 -126.32 446.9 925.82 69.37 10 -936.63 580.38 -235.05 345.33 Cash generated from operations 33 Net Income tax (paid) Net cash flows from in operating activities (A) 23 B. Cash flows from investing activities Capital expenditure for property, plant and equipment, Investment property, Intangible *Assets including Capital Work in Progress 37 Proceeds from disposal of Property, Plant and Equipment and Investment Property Bank balances not considered as Cash and cash equivalents >> Movement in Margin Money Deposits / Other Deposits Purchase of non current investments - Subsidiaries -106.66 134.96 315.65 -527.37 8.09 36.66 15.667 37.645 6.389 3.182 0 0 0 0 6.01 -155.85 0.12 0.413 -0.208 -76.12 0 ola 0.476 105.55 - 12.145 11.265 -7.745 139.16 180.62 1.81 -57.15 199.71 -2.9 18.437 -151.16 265.29 -35.608 290.18 178.60 2.077 -145.53 76.9 -16.76 2.83 65.79 3.07 -359.2 7.79 90.02. 3.93 425.17 365,23 455.24 541.29 0 foto 27.45 Refund of share application money Proceeds from sale of non current and current Investments - Associates Others Loans given to subsidiaries, associates and others 24 Loans realised from subsidiaries, associates and others Inter Corporate Deposits given Inter Corporate Deposits realised 27 Interest received 4* Rental Income from investment properties Net cash flows (used in investing activities (8) * C Cash flows from financing activities Proceeds from issue of Shares (including Securities Premium) Proceeds received against share warrants 33 Repayment of Debentures Proceeds from long term borrowings Repayment of long term borrowings Short term borrowings - (repaid) / borrowed (net) Finance cost Dividend & Tax on dividend paid Net cash flows from / (used) in financing activities (C) Net Increase/ (Decrease) in Cash and cash equivalents (A+B+C) Cash and cash equivalents at the beginning of the year Cash and cash equivalents at the end of the year 0018 -188.30 - 128.91 0 -50 53.874 -156.47 0 -574.63 -26.812 -713.01 140.85 70.998 211.85 -408.27 -40.159 -755.23 -103.19 261.66 495.41 -55.11 -173.39 483.17 371.21 -375.15 431.49 -26.76 -72.42 - 137.24 216.77 49.54 136.93 108.66 59.12 59.12 196.05 211.85 108.66 Q1 Find the three Important factors impact MOC Ltd. ROE? the impact of these factors corner over the three years? Comment on the expected reason for carsteny M Q2 Analyse, NCC Ltd. has been able to manage It's working capital efficiently across the past years from 2016 til 2019). Support your answer with substantive facts and calculations and comment on the same. What working capital polky do you recommend for NCC Ltd. for It's forthcoming years 2020 and 2021? Q3. Looking into the past performance of NOC Ltd., what sales growth percentage do you recommend for the forthcoming years 2020 and 2021. (lustify your choice of using the sales growth for forecasting for years 2020 and 2021 with valid subjective arguments as well) Does NOC Ltd. require AFN for the years 2020 and 2021, yes, then plug in the value with the appropriate source of finandng wested by you for NOC Ltd. 7 Create a Financing Plan for NOC Ltd. and Austify your choice of financing surested for the firm
