i.need to answer d,e,f,g,h,i,j
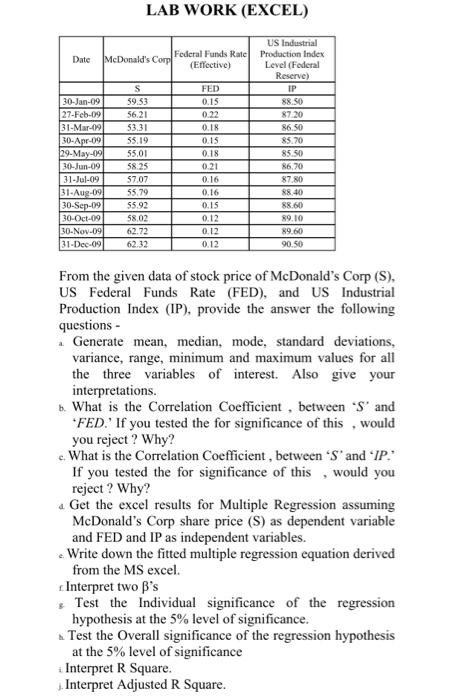
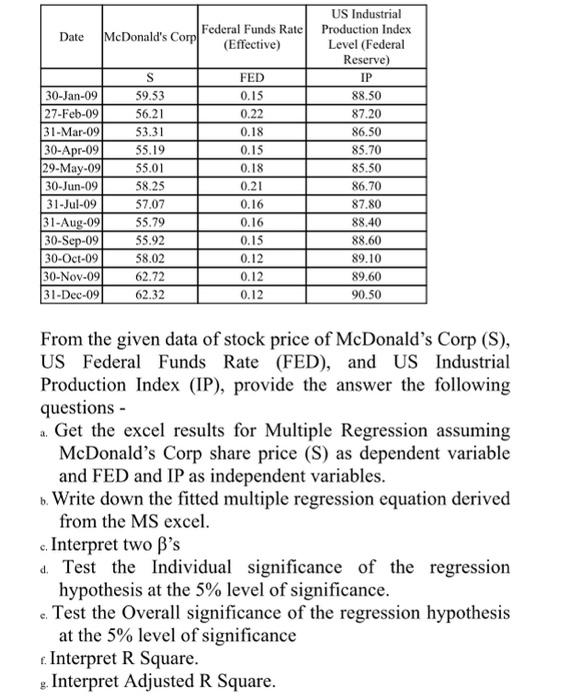
Date Federal Funds Rate McDonald's Corp (Effective) US Industrial Production Index Level (Federal Reserve) IP S FED 59.53 0.15 88,50 56.21 0.22 87.20 53.31 0.18 86.50 55.19 0.15 85.70 55.01 0.18 85.50 58.25 0.21 86.70 30-Jan-09 27-Feb-09 31-Mar-091 30-Apr-09 29-May-091 30-Jun-09 31-Jul-09 31-Aug-09 30-Sep-09 30-Oct-09 30-Nov-09 31-Dec-09 57.07 0.16 87.80 55.79 0.16 88.40 55.92 0.15 88.60 58.02 0.12 89.10 62.72 89.60 0.12 0.12 62.32 90.50 From the given data of stock price of McDonald's Corp (S), US Federal Funds Rate (FED), and US Industrial Production Index (IP), provide the answer the following questions - 2. Get the excel results for Multiple Regression assuming McDonald's Corp share price (S) as dependent variable and FED and IP as independent variables. b. Write down the fitted multiple regression equation derived from the MS excel. c. Interpret two B's d Test the Individual significance of the regression hypothesis at the 5% level of significance. c. Test the Overall significance of the regression hypothesis at the 5% level of significance t. Interpret R Square. g. Interpret Adjusted R Square. LAB WORK (EXCEL) Date Federal Funds Rate McDonald's Corp (Effective) US Industrial Production Index Level (Federal Reserve) IP S FED 59.53 0.15 88.50 56.21 0.22 87.20 53.31 0.18 86.50 55.19 0.15 85.70 55.01 0.18 85.50 30-Jan-09 27-Feb-09 31-Mar-09 30-Apr-09 29-May-09 30-Jun-09 31-Jul-09 31-Aug-091 30-Sep-09 30-Oct-09 58.25 0.21 86,70 57.07 0.16 87.80 55.79 0.16 88.40 55.92 0.15 88.60 58.02 0.12 89.10 ov-09 0.12 89.60 62.7 62.32 31-Dec-09 0.12 90.50 From the given data of stock price of McDonald's Corp (S), US Federal Funds Rate (FED), and US Industrial Production Index (IP), provide the answer the following questions - Generate mean, median, mode, standard deviations, variance, range, minimum and maximum values for all the three variables of interest. Also give your interpretations. b. What is the Correlation coefficient, between 'S' and *FED.' If you tested the for significance of this would you reject? Why? What is the Correlation Coefficient, between 'S' and IP. If you tested the for significance of this would you reject? Why? 4 Get the excel results for Multiple Regression assuming McDonald's Corp share price (S) as dependent variable and FED and IP as independent variables. Write down the fitted multiple regression equation derived from the MS excel. Interpret two B's Test the Individual significance of the regression hypothesis at the 5% level of significance. Test the Overall significance of the regression hypothesis at the 5% level of significance i Interpret R Square. Interpret Adjusted R Square

 i.need to answer d,e,f,g,h,i,j


