Answered step by step
Verified Expert Solution
Link Copied!

Question

1 Approved Answer

Inequalities Complete the table below. Each row represents an inequality in Inequality Notation, as a Graph and in Interval Notation For Graphing: If the symbol
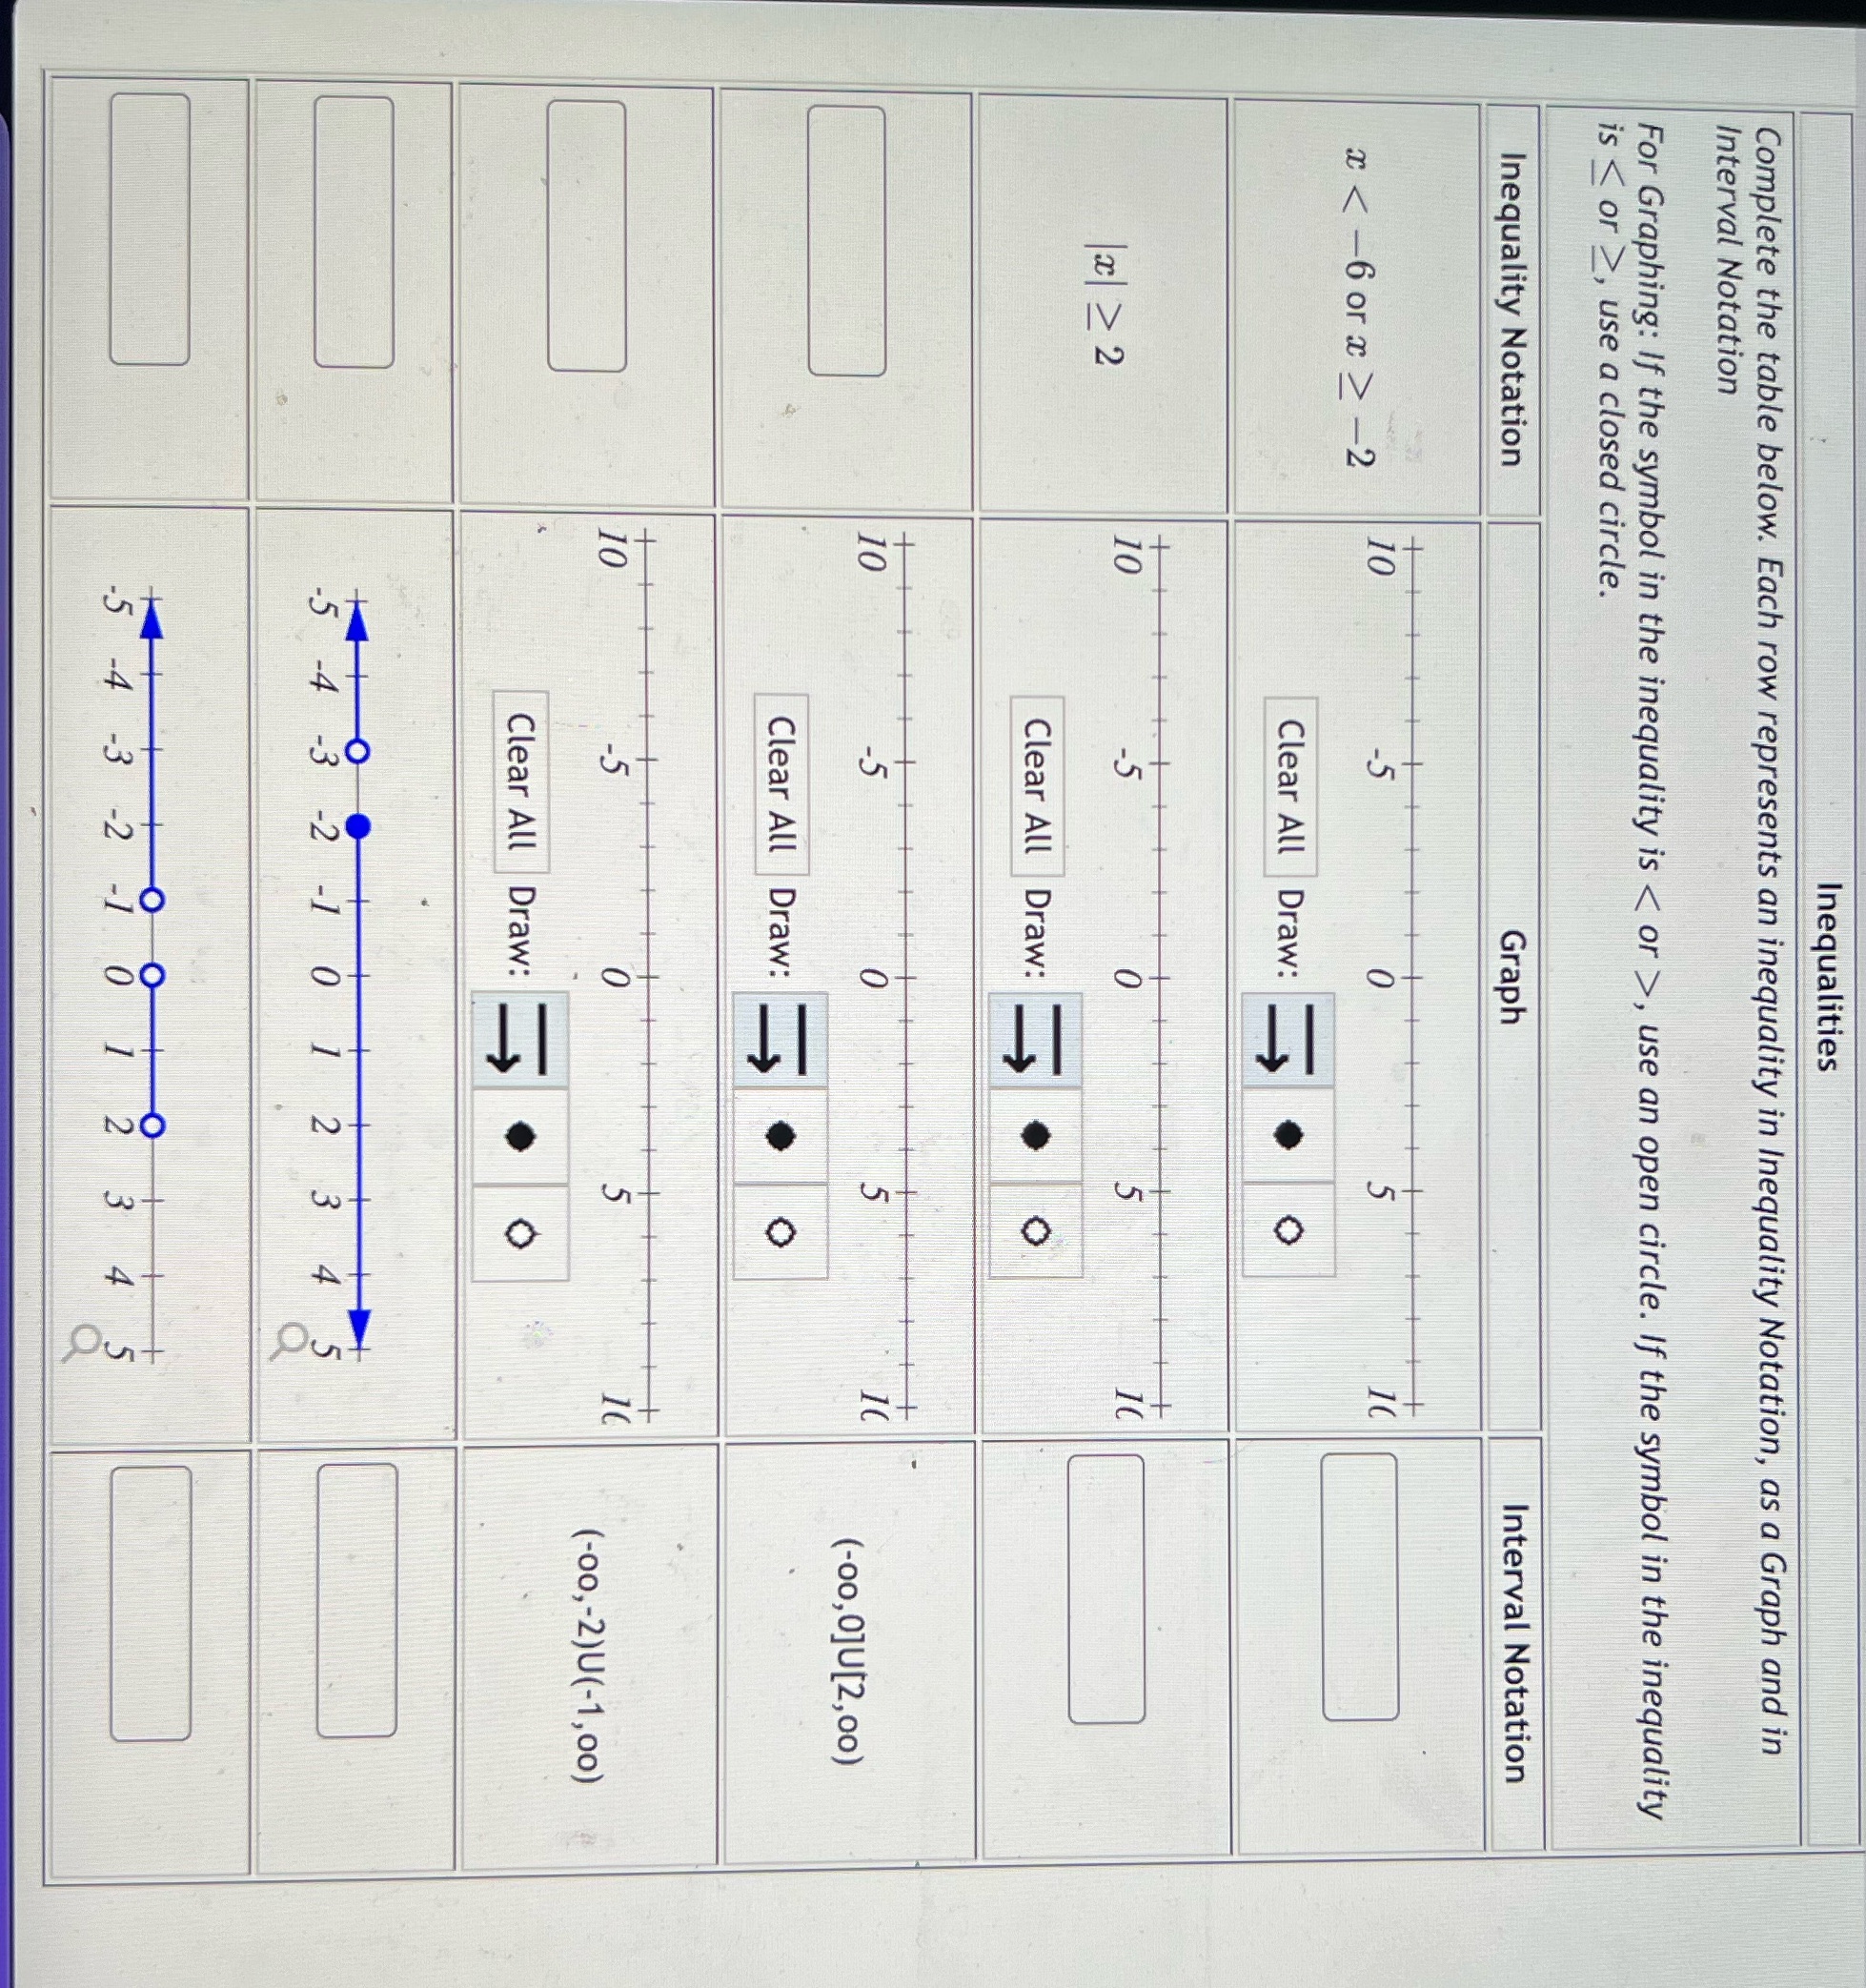
image text in transcribed
Inequalities Complete the table below. Each row represents an inequality in Inequality Notation, as a Graph and in Interval Notation For Graphing: If the symbol in the inequality is , use an open circle. If the symbol in the inequality is , use a closed circle. Inequality Notation Graph Interval Notation a > -2 Clear All Draw: IT 120 2 2 Clear All Draw: IT (-oo,0]U[2,00) Clear All Draw: O IT (-00,-2)U(-1,00) Clear All Draw: O T -4 -3 -2 -1 0 5 -4 -3 -2 -1 ON two

Step by Step Solution

There are 3 Steps involved in it

Step: 1

blur-text-image

Get Instant Access to Expert-Tailored Solutions

See step-by-step solutions with expert insights and AI powered tools for academic success

Step: 2

blur-text-image

Step: 3

blur-text-image

Ace Your Homework with AI

Get the answers you need in no time with our AI-driven, step-by-step assistance

Get Started

Recommended Textbook for

Holt Algebra 1 Ohio

Authors: Edward B. Burger, Holt, Rinehart And Winston

Student Edition

0030932947, 978-0030932946

More Books

Students also viewed these Mathematics questions