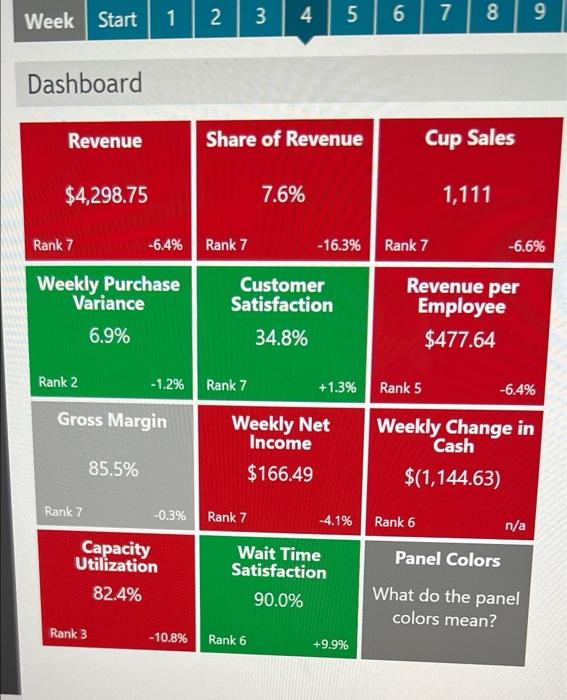
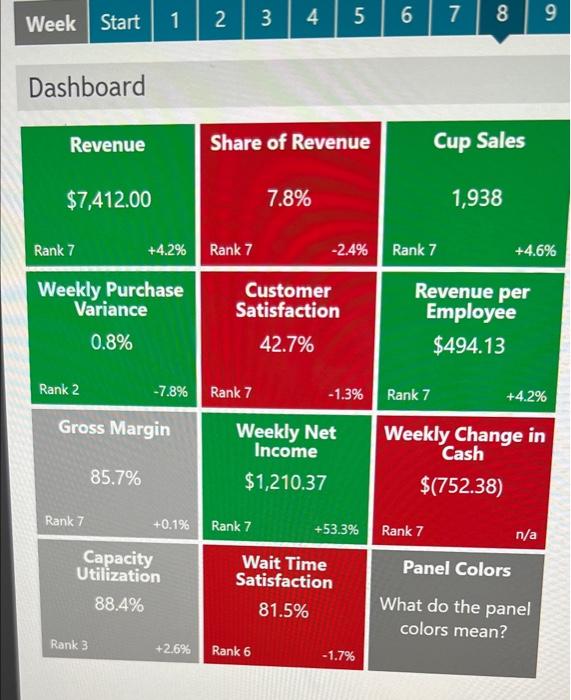
information from Weeks 4 and 8 for both items below.Make sure the information on your graphs is accurate.
Use separate graphs as needed.
Explain your graph in detail and discuss how the two financial measures relate.
i. Cumulative Revenue
ii. Weekly Net Income
1 2 Week Start 3 4 un 5 6 7 9 8 Dashboard Revenue Share of Revenue Cup Sales $4,298.75 7.6% 1,111 Rank 7 -6.4% Rank 7 -16.3% Rank 7 -6.6% Weekly Purchase Variance 6.9% Customer Satisfaction 34.8% Revenue per Employee $477.64 Rank 2 -1.2% Rank 7 +1.3% Rank 5 -6.4% Gross Margin Weekly Net Income $166.49 Weekly Change in Cash $(1,144.63) 85.5% Rank 7 -0.3% Rank 7 -4.1% Rank 6 n/a Capacity Utilization 82.4% Wait Time Satisfaction 90.0% Panel Colors What do the panel colors mean? Rank 3 -10.8% Rank 6 +9.9% 1 2 3 Week Start 4 5 7 6 8 9 Dashboard Revenue Share of Revenue Cup Sales $7,412.00 7.8% 1,938 Rank 7 +4.2% Rank 7 -2.4% Rank 7 +4.6% Weekly Purchase Variance 0.8% Customer Satisfaction 42.7% Revenue per Employee $494.13 Rank 7 -1.3% Rank 7 +4.2% Rank 2 -7.8% Gross Margin Weekly Net Income $1,210.37 Weekly Change in Cash $(752.38) 85.7% Rank 7 +0.1% Rank 7 +53.3% Rank 7 n/a Panel Colors Capacity Utilization 88.4% Wait Time Satisfaction 81.5% What do the panel colors mean? Rank 3 +2.6% Rank 6 -1.7% 1 2 Week Start 3 4 un 5 6 7 9 8 Dashboard Revenue Share of Revenue Cup Sales $4,298.75 7.6% 1,111 Rank 7 -6.4% Rank 7 -16.3% Rank 7 -6.6% Weekly Purchase Variance 6.9% Customer Satisfaction 34.8% Revenue per Employee $477.64 Rank 2 -1.2% Rank 7 +1.3% Rank 5 -6.4% Gross Margin Weekly Net Income $166.49 Weekly Change in Cash $(1,144.63) 85.5% Rank 7 -0.3% Rank 7 -4.1% Rank 6 n/a Capacity Utilization 82.4% Wait Time Satisfaction 90.0% Panel Colors What do the panel colors mean? Rank 3 -10.8% Rank 6 +9.9% 1 2 3 Week Start 4 5 7 6 8 9 Dashboard Revenue Share of Revenue Cup Sales $7,412.00 7.8% 1,938 Rank 7 +4.2% Rank 7 -2.4% Rank 7 +4.6% Weekly Purchase Variance 0.8% Customer Satisfaction 42.7% Revenue per Employee $494.13 Rank 7 -1.3% Rank 7 +4.2% Rank 2 -7.8% Gross Margin Weekly Net Income $1,210.37 Weekly Change in Cash $(752.38) 85.7% Rank 7 +0.1% Rank 7 +53.3% Rank 7 n/a Panel Colors Capacity Utilization 88.4% Wait Time Satisfaction 81.5% What do the panel colors mean? Rank 3 +2.6% Rank 6 -1.7%