Answered step by step
Verified Expert Solution
Question
1 Approved Answer
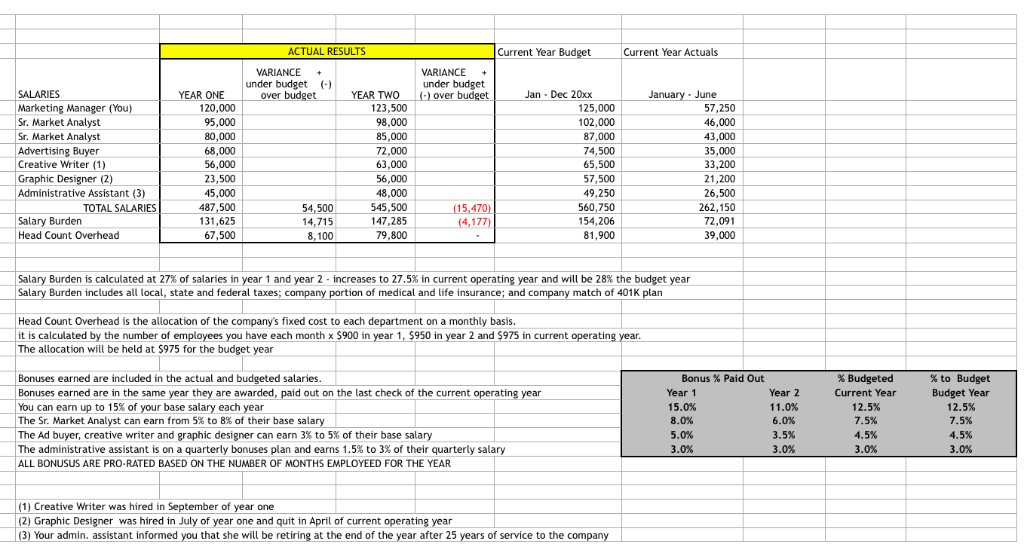
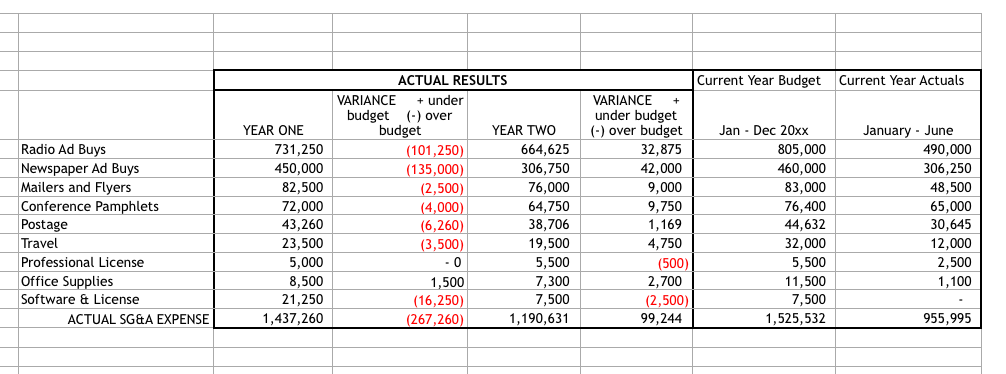
Information for next years budget Revenue is projected to be $24,150,000 based on expanding into the West Coast A regional office is to be opened
Information for next years budget Revenue is projected to be $24,150,000 based on expanding into the West Coast A regional office is to be opened on the West Coast and the CEO expects all managers to spend time in the office as well as have a full time marketing employee at the office.
1.) Prepare next years budget based on the above information and past years experience.
2.) You must provide an explanation / justification for each line item in the budget and salaries can be considered one line item.
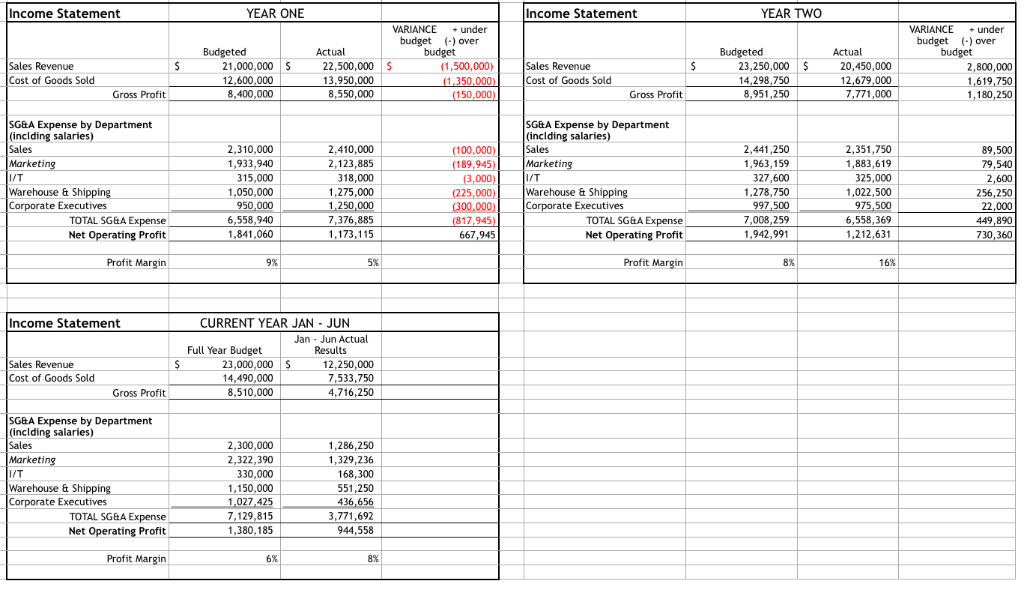
Income Statement YEAR ONE Income Statement YEAR TWo * under over Actual budget Budgeted Actual budget Sales Revenue Cost of Goods Sold 21,000,000 S 12,600,000 22,500,000 S 13,950,000 23,250,00020,450,000 12,679,000 7,771,000 (1,500,000) Sales Revenue Cost of Goods Sold 14,298,750 8,951,250 2,800,000 1,619,750 1,180,250 8,400,000 8,550,000 150,000 Gross Profit SGEA Expense by Department (inclding salaries) Sales Marketin I/T Warehouse & Shi 2,310,000 1,933,940 315,000 1,050,000 950,000 6,558,940 1,841,060 2,410,000 2,123,885 318,000 1,275,000 1.250,000 7,376,885 1,173,115 SGBA Expense by Department (inclding salaries) Sales Marketin 2,441,250 1,963,159 327,600 1,278,750 997,500 7,008,259 1,942,991 100,000) 2,351,750 1,883,619 325,000 1,022,500 975,500 6,558,369 1,212,631 89,500 79,540 (189,945 5,000) 817,945 Warehouse &Shi 256,250 22,000 449,890 730,360 TOTAL SG&A Expense Net Operating Profit TOTAL SG&A Expense Net Operating Profit 667,945 Profit Margin Profit Margin 16% ncome Statement CURRENT YEAR JAN -JUN Jan Jun Actual Results Full Year Budget Sales Revenue Cost of Goods Sold 23,000,000 14,490,000 8,510,000 12,250,000 7,533,750 4,716,250 Gross Profit SGEA Expense by Department sa Sales Marketin I/T Warehouse & Shippin 2,300,000 2,322,390 330,000 1,150,000 1,286,250 1,329,236 168,300 551,250 TOTAL SG&A Expense Net Operating Profit 7,129,815 1,380,185 3,771,697 944,558 Profit Margin 8% ACTUAL RESULTS Current Year Budget Current Year Actuals VARIANCE under budget () over budget VARIANCE + under budget (-) over budget 32,875 42,000 9,000 9,750 1,169 4,750 500 2,700 YEAR ONE YEAR TWO Jan - Dec 20xx January - June Radio Ad Buys Newspaper Ad Buys Mailers and Flyers Conference Pamphlets Postage Travel ProfessionalLicense Office Supplies Software &License 731,250 450,000 82,500 72,000 43,260 23,500 5,000 8,500 21,250 1,437,260 (101,250) (135,000) 2,500 4,000 (6,260) 3,500 664,625 306,750 76,000 64,750 38,706 19,500 5,500 7,300 7,500 1,190,631 805,000 460,000 83,000 76,400 44,632 32,000 5,500 11,500 7,500 1,525,532 490,000 306,250 48,500 65,000 30,645 12,000 2,500 1,100 1,500 (16,250) (267,260) (2,500) ACTUAL SG&A EXPENSE 99,244 955,995Step by Step Solution
There are 3 Steps involved in it
Step: 1
Get Instant Access to Expert-Tailored Solutions
See step-by-step solutions with expert insights and AI powered tools for academic success
Step: 2
Step: 3
Ace Your Homework with AI
Get the answers you need in no time with our AI-driven, step-by-step assistance
Get Started