

Question
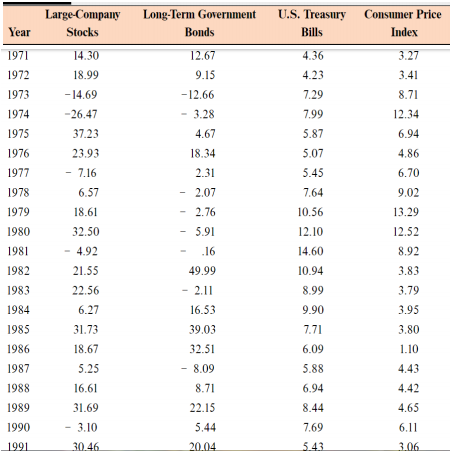
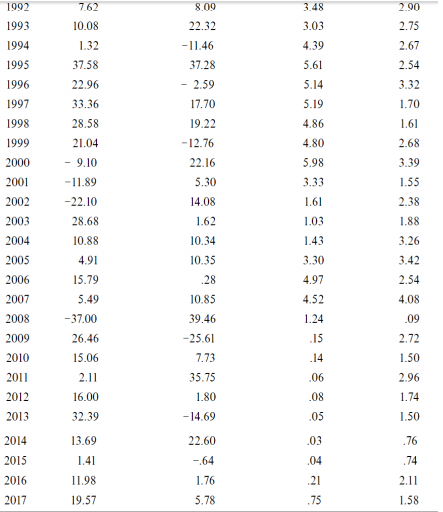
**information** Using the table above for returns and inflation look at the period from 1973 through 1978. A Period calculate that arithmetic average return for
**information**
Using the table above for returns and inflation look at the period from 1973 through 1978.
A Period calculate that arithmetic average return for the large company stocks and T-bills over
this time period.
B. Calculate the standard deviation of returns for large company stocks and T-bills over this time
period.
C. Calculate the observed risk premium each year for large company stocks versus T-bills. What
was the arithmetic average rich premium over this.? What was the standard deviation of the risk
premium over this.?
D. Is it possible for the risk premium to be negative before an investment is undertaken ? Can
the risk premium be negative after the fact? Explain
A. Return year 1-2=(Price year 2+ Dividend year 2)/Price year 1-1
=(71.4+0.64)/64.53-1
=11.64%
Return year 2-3=(Price year 3+ Dividend year 3)/Price year 2-1
=(77.2+0.69)/71.4-1
=9.09%
Return year 3-4=(Price year 4+ Dividend year 4)/Price year 3-1
=(63.47+0.75)/77.2-1
=-16.81%
Return year 4-5=(Price year 5+ Dividend year 5)/Price year 4-1
=(73.51+0.84)/63.47-1
=17.14%
Return year 5-6=(Price year 6+ Dividend year 6)/Price year 5-1
=(81.75+0.91)/73.51-1
=12.45%
Arithmetic return = (Return year 1-2 + Return year 2-3 + Return year 3-4 + Return year 4-5 + Return year 5-6)/5
=(+0.1164+0.0909-0.1681+0.1714+0.1245)/5
=6.7%
Geometric return = ((1+Return year 1-2)*(1 + Return year 2-3)*(1 + Return year 3-4)*(1 + Return year 4-5)*(1 + Return year 5-6))^(1/5)-1
= ((1+0.1164)*(1+0.0909)*(1-0.1681)*(1+0.1714)*(1+0.1245))^(1/5)-1
=5.94%
B.
Year Large comp stock T BILL premium (R (LC) - R(avg))^2 (R (T bill) - R(avg))^2 (R.P- R.P (avg))^2
1973 -14.69 7.29 -21.98 321.305625 0.545136111 348.3200111
1974 -26.47 7.99 -34.46 882.387025 2.068802778 969.9072111
1975 37.23 5.87 31.36 1155.660025 0.464669444 1202.471211
1976 23.93 5.07 18.86 428.283025 2.195336111 491.8045444
1977 -7.16 5.45 -12.61 108.056025 1.213669444 86.36604444
1978 6.57 7.64 -1.07 11.122225 1.184469444 5.047511111
TOTAL 19.41 39.31 -19.9 2906.81395 7.672083333 3103.916533
AVG 3.235 6.551667 -3.31667
var (Large stock) 581.36279
Std dev (large stock) 24.11146594
var (t bill) 1.534416667
std dev (t bill) 1.238715733
var (risk premium) 620.7833067
std dev (risk premium) 24.91552341
C.
var (risk premium) 620.7833067
std dev (risk premium) 24.91552341
D. A risk premium is the investment return an asset is expected to yield in excess of the risk-free rate of return. An asset's risk premium is a form of compensation for investors. It represents payment to investors for tolerating the extra risk in a given investment over that of a risk-free asset. For most assets the risk premium will be positive, investors demand compensation over and above the risk-free return to invest their money in the risky asset. But in some cases, the observed risk premium can be negative if the asset's nominal return is unexpectedly low, the risk-free return is unexpectedly high, or some combination.
***answer this****
Suppose the returns on long term government bonds are normally distributed. Based on the arithmetic average and standard deviation above what is the approximate probability that your return on these bonds will be less than 3.24% in a given year? What range of return would you expect to see 95% of the time? What range would you expect to see 99% of the time?
Large-Company Stocks Long-Term Government Bonds U.S. Treasury Bills Consumer Price Index Year 14.30 4.36 12.67 9.15 -12.66 3.27 3.41 18.99 4.23 7.29 8.71 7.99 12.34 - 3.28 4.67 - 14.69 -26.47 37.23 23.93 - 7.16 6.57 6.94 4.86 6.70 1971 1972 1973 1974 1975 1976 1977 1978 1979 1980 1981 1982 1983 1984 1985 1986 1987 1988 18.34 2.31 - 2.07 - 2.76 5.91 5.87 5.07 5.45 7.64 10.56 12.10 18.61 9.02 13.29 12.52 .16 14.60 32.50 - 4.92 21.55 22.56 8.92 3.83 10.94 8.99 3.79 3.95 6.27 9.90 49.99 - 2.11 16.53 39.03 32.51 - 8.09 8.71 7.71 6.09 3.80 1.10 5.88 31.73 18.67 5.25 16.61 31.69 - 3.10 30.46 4.43 4.42 6.94 8.44 1989 4.65 22.15 5.44 7.69 6.11 1990 1991 20.04 5.43 3.06 1992 7.62 8.00 3.48 2.00 10.08 3.03 22.32 -11.46 37.28 - 2.59 17.70 4.39 5.61 2.75 2.67 2.54 3.32 1.70 5.14 5.19 19.22 1.61 1.32 37.58 22.96 33.36 28.58 21.04 - 9.10 -11.89 -22.10 28.68 10.88 2.68 4.86 4.80 5.98 3.33 3.39 1.55 2.38 1.61 1.03 1.88 -12.76 22.16 5.30 14.08 1.62 10.34 10.35 .28 10.85 39.46 -25.61 1.43 3.26 1993 1994 1995 1996 1997 1998 1999 2000 2001 2002 2003 2004 2005 2006 2007 2008 2009 2010 2011 2012 2013 2014 2015 2016 2017 4.91 3.30 3.42 15.79 4.97 2.54 4.08 5.49 -37.00 26.46 15.06 4.52 1.24 .15 .09 2.72 1.50 7.73 .14 2.11 .06 2.96 16.00 35.75 1.80 - 14.69 .08 1.74 32.39 .05 1.50 13.69 .76 .03 .04 .74 1.41 11.98 19.57 22.60 -64 1.76 5.78 2.11 .21 .75 1.58 Large-Company Stocks Long-Term Government Bonds U.S. Treasury Bills Consumer Price Index Year 14.30 4.36 12.67 9.15 -12.66 3.27 3.41 18.99 4.23 7.29 8.71 7.99 12.34 - 3.28 4.67 - 14.69 -26.47 37.23 23.93 - 7.16 6.57 6.94 4.86 6.70 1971 1972 1973 1974 1975 1976 1977 1978 1979 1980 1981 1982 1983 1984 1985 1986 1987 1988 18.34 2.31 - 2.07 - 2.76 5.91 5.87 5.07 5.45 7.64 10.56 12.10 18.61 9.02 13.29 12.52 .16 14.60 32.50 - 4.92 21.55 22.56 8.92 3.83 10.94 8.99 3.79 3.95 6.27 9.90 49.99 - 2.11 16.53 39.03 32.51 - 8.09 8.71 7.71 6.09 3.80 1.10 5.88 31.73 18.67 5.25 16.61 31.69 - 3.10 30.46 4.43 4.42 6.94 8.44 1989 4.65 22.15 5.44 7.69 6.11 1990 1991 20.04 5.43 3.06 1992 7.62 8.00 3.48 2.00 10.08 3.03 22.32 -11.46 37.28 - 2.59 17.70 4.39 5.61 2.75 2.67 2.54 3.32 1.70 5.14 5.19 19.22 1.61 1.32 37.58 22.96 33.36 28.58 21.04 - 9.10 -11.89 -22.10 28.68 10.88 2.68 4.86 4.80 5.98 3.33 3.39 1.55 2.38 1.61 1.03 1.88 -12.76 22.16 5.30 14.08 1.62 10.34 10.35 .28 10.85 39.46 -25.61 1.43 3.26 1993 1994 1995 1996 1997 1998 1999 2000 2001 2002 2003 2004 2005 2006 2007 2008 2009 2010 2011 2012 2013 2014 2015 2016 2017 4.91 3.30 3.42 15.79 4.97 2.54 4.08 5.49 -37.00 26.46 15.06 4.52 1.24 .15 .09 2.72 1.50 7.73 .14 2.11 .06 2.96 16.00 35.75 1.80 - 14.69 .08 1.74 32.39 .05 1.50 13.69 .76 .03 .04 .74 1.41 11.98 19.57 22.60 -64 1.76 5.78 2.11 .21 .75 1.58Step by Step Solution
There are 3 Steps involved in it
Step: 1

Get Instant Access to Expert-Tailored Solutions
See step-by-step solutions with expert insights and AI powered tools for academic success
Step: 2

Step: 3
Ace Your Homework with AI
Get the answers you need in no time with our AI-driven, step-by-step assistance
Get Started
Contemporary Financial Management
Authors: R. Charles Moyer, James R. Mcguigan, William J. Kretlow
9th Edition
032416470X, 9780324164701